
Canada Gazette, Part I, Volume 157, Number 33: Clean Electricity Regulations
August 19, 2023
Statutory authority
Canadian Environmental Protection Act, 1999
Sponsoring departments
Department of the Environment
Department of Health
REGULATORY IMPACT ANALYSIS STATEMENT
(This statement is not part of the Regulations.)
Executive summary
Issues: There is an urgent need to address climate change and Canada is committed to do its part. As climate change makes weather patterns more extreme and volatile, weather-related disasters (e.g. floods, storms and wildfires) are becoming more frequent and costlier. Insured losses as a result of catastrophic weather events in Canada totalled over $18 billion (2019 $CAD) between 2010 and 2019, while the number of catastrophic weather events in this period was over three times higher than it had been between 1980 and 1989.footnote 1 Without rapid mitigation to reduce greenhouse gas (GHG) emissions to keep the global temperature increase below 1.5 °C (degrees Celsius) relative to pre-industrial levels, the adverse impacts of climate change are projected to escalate beyond adaptive capacity (the ability of social-ecological systems to adapt to environmental change)footnote 2, affecting disproportionally the most vulnerable of our population. In addition to causing catastrophic environmental and human health impacts, climate change will also entail significant social, cultural and economic losses in Canada. In an effort to help limit the worst of these impacts and based on the overwhelming conclusion of climate science, in 2021, Canada joined over 120 countries in committing to be a net-zerofootnote 3 GHG emissions economy by 2050.
In order to achieve net-zero GHG emissions economy-wide by 2050, the electrification of energy-intensive activities, such as transportation, heating and cooling of buildings and various industrial processes, will be needed. For that electrification to have the desired impact, electricity generation will need to come from low and non-emitting electricity generation sources (see Table 3 for a description of these technologies) and this will need to happen much earlier than 2050. Considering, for example, that the Government of Canada (the Government) has proposed a sales mandate to ensure that 100% of light-duty vehicles sales would be zero GHG emissions vehicles by 2035,footnote 4 the Government has determined that without federal regulations to ensure the electricity-generating sector is prepared to supply cleaner electricity from low and non-emitting electricity generating sources by 2035, the sector would not be on a path that would enable the economy to reach net-zero GHG emissions by 2050.
Description: The proposed Clean Electricity Regulations (the proposed Regulations) would establish performance standards to reduce GHG emissions from fossil fuel–generated electricity starting in 2035.
Rationale: The proposed Regulations would accelerate progress towards a net-zero electricity-generating sector, helping Canada become a net-zero GHG emissions economy by 2050. These efforts are needed to help limit the worst impacts of climate change. The proposed Regulations would set performance standards that would ensure that the sector achieves significant transformation by 2035, so that a robust foundation of clean electricity is available to power the electric technologies (e.g. electric transportation) needed to support Canada’s transition to a net-zero GHG emissions economy by 2050.
A cost-benefit analysis (CBA) was conducted using outputs from two departmental models, NextGrid and E3MC, in a manner that seeks to minimize the system-wide (national) cost of meeting electricity demand subject to many constraints including policy parameters, system reliability and resource availability (e.g. geological constraints). The CBA acknowledges a variety of external economic and environmental changes that may occur over the analytical period by using conservative assumptions where appropriate and by testing alternative parameters in sensitivity analysis. The CBA represents central case modelling in which electricity demand increases by 40% over the analytical period. This central case scenario does not represent the only path that the electricity-generating sector could take to comply with the regulatory requirements, which will ultimately depend on investment decisions taken at the provincial level. Based on the set of assumptions used within the central case modelling, the CBA estimates that the proposed Regulations would result in a net reduction of 342 million metric tonnes (Mt) of carbon dioxide equivalent units (CO2e) of GHG emissions between 2024 and 2050 (the 27-year analytical period). The incremental benefit associated with these GHG reductions, alongside cost savings to the electricity system, is estimated to be $102.5 billion, while the incremental cost is estimated to be $73.6 billion over the 27-year analytical period, thereby resulting in a net benefit to society of $28.9 billion (2022 constant dollars, discounted to base year 2023 at a 2% discount rate).
Issues
There is an urgent global need to address climate change and Canada is committed to do its part. Climate change is responsible for significant extreme weather, food supply disruptions and increased wildfires worldwide. Over the past five decades in Canada, the annual costs of weather-related disasters like floods, storms and wildfires have risen from tens of millions of dollars to billions of dollars. From 2010 to 2019, the number of catastrophic events was over three times higher than during the 1980s. Weather-related disaster damages are among the most visible indicators of the costs of climate change; yet these costs provide an incomplete picture since they do not represent the full range of social (e.g. human health impacts), economic and environmental damages of climate change.footnote 5 The world has already warmed by about 1.0 °C (degrees Celsius) above pre-industrial levels (1850-1900) due to human activities and is experiencing the related negative impacts. At the current rate of warming of 0.2 °C per decade, global warming will reach 1.5 °C between 2030 and 2052.footnote 6 Without rapid mitigation to reduce GHG emissions to limit global warming to 1.5 °C, the adverse impacts of climate change are projected to escalate beyond adaptive capacity, affecting the most vulnerable members of our society disproportionally. In 2021, Canada joined over 120 countries in committing to a net-zero GHG emissions economy by 2050footnote 7 to help limit global warming to 1.5 °C and avoid the worst impacts of climate change.
In order to achieve net-zero GHG emissions economy-wide by 2050, the electrification of energy-intensive activities, such as transportation,footnote 8 heating and cooling of buildings, as well as various industrial processes, will be needed. Even in the absence of regulatory action to control electricity sector emissions of carbon dioxide, this needed electrification will require significant investment to maintain, upgrade and expand Canada’s fleets of electricity generators. Preliminary estimates by the Department indicate that such investments are likely to be more than $400 billion. If electrification is to have the required GHG reduction impact, then the investments will need to be directed to low and non-emitting electricity generation sources (see Table 3 for a description of these technologies) and this will need to happen much earlier than 2050. Without federal regulations to ensure the electricity-generating sector is prepared to supply cleaner electricity from low and non-emitting electricity generating sources by 2035, the sector would not be on a path that would enable the economy to reach net-zero GHG emissions by 2050.
Background
Urgent need to address climate change and Canada’s climate change commitments
Reducing global GHG emissions to net-zero by 2050 provides the best chance to limit severe climate change related risks due to global warming. GHGs are a natural part of the Earth’s geological systems; however, human activities such as the burning of fossil fuels are rapidly increasing levels of atmospheric GHGs. This increased concentration of GHGs in the atmosphere increases the temperature on Earth’s surface (global warming), thus causing climate change. With increasing global surface temperatures, the probability of more droughts and increased intensity of storms will occur. As more water is evaporated into the atmosphere, it fuels increasingly powerful storms. More heat in the atmosphere and warmer ocean surface temperatures can lead to increased wind speeds in tropical storms. Rising sea levels expose higher locations not previously subject to the power and destructive capacity of oceans, including the erosive forces of waves and currents. The Earth has already warmed by about 1.0 °C above pre-industrial levels due to human activities and is experiencing the consequential impacts. In 2022, the Intergovernmental Panel on Climate Change (IPCC) released the report Climate Change 2022: Impacts, Adaptation, and Vulnerability (PDF) that assessed that climate change, including increases in the frequency and intensity of climate and weather extremes, has caused widespread adverse impacts on ecosystems, agriculture, food, water, human health, livelihoods and economic activity. By disproportionately affecting the most vulnerable, especially through impacts on food, water and livelihoods, climate change can further exacerbate existing inequalities and inequities, both domestically and worldwide. The Canadian Disaster Database (CDD) tracks the most significant weather-related hazards, in terms of frequency, cost and displaced people. The CDD estimates that natural disaster costs totalled $35 billion (2019 $CAD) for 300 of the 645 weather-related disasters recorded since 1970. Floods were the most frequently reported weather-related disasters (40% of the total number of disasters), followed by severe thunderstorms (18%), wildfires (15%) and winter storms (9%). Hail, wind and ice events are included in these categories. The annual number of disasters in the CDD has steadily increased since the 1970s, fluctuating between a low of 8 in the early 1970s to a high of 27 per year in 2016. In addition to an increase in the number of disasters, the cost per disaster has also increased — rising from an average of $8.3 million (2019 $CAD) per event in the 1970s to an average $112 million (2019 $CAD) per event in the 2010s. This change represents a 1 250% increase over four and a half decades.footnote 1
At the current rate of warming of 0.2 °C per decade, global warming will reach 1.5 °C between 2030 and 2052. Considering the impacts of climate change associated with global warming already reaching 1.0 °C above pre-industrial levels, near-term increases in global warming reaching 1.5 °C would cause unavoidable increases in multiple hazards and present risks to ecosystems and humans beyond adaptive capacity. Near-term actions that would limit global warming close to 1.5 °C would substantially reduce future risks compared to those at higher warming levels. The effects of widespread climate change are already evident in many parts of Canada and are projected to intensify in the future. In addition to significant environmental loss, including accelerated habitat and species loss, this will have a negative impact on the social (e.g. human health impacts), cultural and economic life of Canada and its people.
According to the International Energy Agency,footnote 9 global annual GHG emissions have increased 60% from 21.4 gigatonnes (Gt)footnote 10 in 1990 to 34.2 Gt in 2020. Over the same period, Canada’s emissionsfootnote 11 increased 13% from 595 megatonnes (Mt) to 672 Mt. Although Canada’s contribution to global totals may seem relatively small, per capita Canada ranks as the 7th highest GHG emitter globally.footnote 12
Canada has been active in seeking to reduce GHG emissions both internationally and nationally
Internationally
- In 2015, Canada and 194 other countries concluded negotiations on the Paris Agreement; in the Agreement, Canada set a goal to reduce its GHG emissions by 30% below 2005 levels by 2030, which Canada amended in 2021 to set a 2030 goal of reducing GHG emissions by 40–45% below 2005 levels.
- In 2021, Canada joined over 120 countries by committing to be a net-zero GHG emissions economy by 2050.
- On May 11, 2023, the United States Environmental Protection Agency published the Greenhouse Gas Standards and Guidelines for Fossil Fuel-Fired Power Plants.
Nationally
- In 2016, the Pan-Canadian Framework on Clean Growth and Climate Change (PCF): Canada’s plan to address climate change and grow the economy (PDF) was published and included more than 50 measures to drive down Canada’s GHG emissions, help build resilience across the country and support climate innovation for clean economic growth. The PCF was developed in collaboration with Canada’s provinces and territories and in consultation with national Indigenous organizations, interested parties and Canadians.
- The federal Greenhouse Gas Pollution Pricing Act (GGPPA) came into force on June 21, 2018. The GGPPA establishes the framework for the federal backstop carbon pollution pricing system (putting a price on GHGs), which consists of two parts: a regulatory charge on fossil fuels like gasoline and natural gas, the fuel charge under Part 1 of the GGPPA and regulatory trading system for industry known as the Output-Based Pricing System (OBPS), under Part 2 of the GGPPA. The OBPS is designed to put a price on carbon pollution, creating an incentive for industrial facilities from sectors at significant risk of carbon leakage and competitiveness impacts to reduce their GHG emissions per unit of output. Under the Government of Canada’s approach to pricing carbon pollution, provinces and territories have the flexibility to implement a carbon pricing system that makes sense for their circumstances, provided that the system meets the minimum national stringency criteria (the federal benchmark). Since 2019, every jurisdiction in Canada has had a price on carbon pollution.
- In 2020, the Healthy Environment and a Healthy Economy: Canada’s strengthened climate plan to create jobs and support people, communities and the planet was published. It builds on the PCF and included 64 strengthened and new federal policies, programs and investments to cut carbon pollution and build a stronger, cleaner and more resilient and inclusive economy.
- In 2021, the Canadian Net-Zero Emissions Accountability Act (CNZEAA) was enacted. The CNZEAA formalizes Canada’s target to achieve net-zero GHG emissions economy-wide by 2050. It establishes a series of interim GHG emissions reduction targets at five-year milestones and requires a series of plans and reports to help Canada achieve its milestones on the way towards that goal. Pursuant to the CNZEAA, the Net-Zero Advisory Body (NZAB) was established with the mandate to provide independent advice with respect to achieving Canada’s target of net-zero GHG emissions economy-wide by 2050.footnote 13
- In March 2022, Canada’s 2030 Emissions Reduction Plan (2030 ERP): Canada’s next steps for clean air and a strong economy (PDF) was published. The 2030 ERP includes key measures the Government of Canada intends to take in order to achieve the 2030 target (40–45% GHG emission reductions below 2005 levels), an interim GHG emissions objective for 2026, an overview of relevant sectoral strategies and a projected timetable for implementation of these measures. The 2030 ERP provides a roadmap toward achieving net-zero GHG emissions economy-wide by 2050.
Canada’s climate change strategy for electricity generation
According to Canada’s 2022 National Inventory Report (2022 NIR)footnote 14, Part 3, in 2020, Canada generated 575,000 Gigawatt hours (GWh)footnote 15 of electricity and emitted 62 Mt of carbon dioxide (CO2) equivalent, abbreviated as CO2efootnote 16 (9.2% of total national GHG emissions). Of the electricity generated that year, 16% came from emitting electricity sources that use fossil fuels (e.g. coal, natural gas, other fuels such as refined petroleum products) while 84% were from low and non-emitting electricity sources that use renewable fuels (e.g. nuclear and renewables, such as hydro, wind and solar) to power generation. Table 1 provides a breakdown of electricity generation by emitting and low and non-emitting electricity sources and CO2e emissions by region in 2020.
| Region | Electricity generation (GWh) | % of generation from low- and non- emitting electricity sources | % of generation from emitting sources | CO2e emissions (kt) from emitting electricity generation |
|---|---|---|---|---|
| NL | 39,800 | 97% | 3% | 950 |
| PE | 660 | 100% | 0% | 0.3 |
| NS | 9,420 | 21% | 79% | 6,340 |
| NB | 12,000 | 70% | 30% | 3,470 |
| QC | 188,000 | 99% | 1% | 290 |
| ON | 149,000 | 94% | 6% | 3,710 |
| MB | 37,200 | 100% | 0% | 28 |
| SK | 24,000 | 22% | 78% | 13,900 |
| AB | 55,800 | 15% | 85% | 32,700 |
| BC | 58,400 | 97% | 3% | 420 |
| YK | 530 | 83% | 17% | 54 |
| NT | 350 | 74% | 26% | 62 |
| NU | 200 | 0% | 100% | 150 |
| Canada | 575,000 | 84% | 16% | 62,100 |
The 2022 NIR shows that GHG emissions from the emitting electricity-generating sector have been cut by more than half from 132 Mt of CO2e in the year 2000 to 62 Mt of CO2e in 2020, while electricity generation, which was 539,000 GWh in 2000, did not fluctuate significantly. Table 2 provides a breakdown by emitting and low- and non-emitting electricity generation sources in 2000 and 2020 in Canada.
| Electricity generation (GWh) by fuel | Coal | Natural gas | Other fuels | Nuclear | Hydro | Other renewables | Total electricity generation (GWh) | CO2e emissions (kt) from emitting electricity generation |
|---|---|---|---|---|---|---|---|---|
| 2000 | 106,440 | 26,616 | 13,250 | 68,650 | 323,130 | 260 | 538,346 | 132,044 |
| % of total electricity generation | 20% | 5% | 2% | 13% | 60% | 0.05% | 100% | - |
| 2020 | 35,940 | 47,978 | 7,346 | 92,590 | 354,980 | 36,180 | 575,013 | 62,197 |
| % of total electricity generation | 6% | 8% | 1% | 16% | 62% | 6% | 100% | - |
Table 2 shows that the GHG emission reductions from 2000 to 2020 were mostly driven by a significant decrease in the use of coal as a fuel to generate electricity (from 20% in 2000 to 6% in 2020) and adoption of low and non-emitting electricity generation sources (from 73% in 2000 to 84% in 2020).
Federal actions (regulatory and non-regulatory) to support the reduction of GHG emissions from the emitting electricity-generating sector
Canada continues to be active in seeking GHG emission reductions from the electricity-generating sector, this includes federal regulatory and non-regulatory actions including
Regulatory actions
- The Canadian Environmental Protection Act, 1999 (CEPA, or the Act) aims to prevent pollution and protect the environment and human health. The Act sets out rules for preventing and regulating toxic substances, including GHG substances (e.g. carbon dioxide and methane) and provides the authority for the Governor in Council (GIC) to make regulations to manage pollution in Canada. Regulatory authorities under both CEPA and the GGPPA have been used to reduce GHG emissions from the electricity sector.
- In 2012, the Reduction of Carbon Dioxide Emissions from Coal-fired Generation of Electricity Regulations were published for the purpose of establishing a regulatory regime to reduce CO2 emissions resulting from conventional coal-fired electricity generation.
- In 2018, the Regulations Amending the Reduction of Carbon Dioxide Emissions from Coal-fired Generation of Electricity Regulations were published to accelerate the reduction of CO2 emissions from conventional coal-fired electricity generation by 2030 to help Canada meets its GHG emissions reduction commitment under the Paris Agreement.
- In 2018, the Government published the Regulations Limiting Carbon Dioxide Emissions from Natural Gas-fired Generation of Electricity to limit CO2 emissions from the use of natural gas as a fuel to generate electricity in Canada.
- Since 2019, the federal backstop carbon pollution pricing system has been in place in jurisdictions that requested it, or that did not have a system that meets the federal national minimum stringency criteria (the federal benchmark). Carbon Pricing is applied to industrial sectors, including the electricity sector through the federal output-based pricing system (OBPS) or an applicable provincial carbon pricing system.footnote 17 These systems, including the OBPS, are designed to ensure there is a price incentive for companies to reduce their GHG emissions and spur innovation while maintaining competitiveness and protecting against carbon leakage. Under the OBPS, industrial facilities face a carbon price on the portion of their GHG emissions that are above their facility emission limit, which is determined based on relevant output-based standards (OBS). As of 2030, electricity generation capacity from gaseous fuel that meets specified criteria and that was put in place on or after January 1, 2021, whether at an existing or new facility, would be fully exposed to the carbon price. Any such electricity generation capacity that existed prior to 2021 would be subject to the carbon price only for the portion of GHG emissions above the OBS of 370 t /GWh.
Non-regulatory actions
- Since 2016, the Government of Canada has directed over $50 billion in targeted investments towards building net-zero electricity systems in Canada. This includes programs such as the Smart Renewables Electrification Pathways Program (SREP), a $1.57 billion program, including $600 million announced in Budget 2022, which provides support for smart renewable energy and electrical grid modernization projects, including projects that support capacity building. Since December 2021 to February 2023, the SREP provided funding for about $164.5 million.footnote 18 In Budget 2023, the Government of Canada announced an increase in funding of $3 billion for the SREP.
- The Government of Canada provides low-interest financing to clean electricity projects through a variety of mechanisms, including investments and financing from the Canada Infrastructure Bank (CIB) and Strategic Innovation Fund, as well as federal tax incentives. These initiatives total more than $20 billion. This includes:
- The Canada Growth Fund ($15 billion to fund investments in support of a net-zero GHG emissions economy); and
- Budget 2023 announced a new investment target for the Canada Infrastructure Bank of at least $10 billion through the Clean Power priority area for building of major clean electricity.
Despite these actions and the fact that in 2020, only 16% of the electricity generated in Canada came from emitting electricity sources, analysis shows that Canada’s emitting electricity-generating sector is not on a path to achieve significant emissions transformation by 2035. For Canada to meet its economy-wide, net-zero emissions target by 2050, significant growth in clean electricity supply is needed. There is a broad consensus among researchers that the increased use of electric technologies (e.g. electric transportation, heating and cooling of buildings and solutions for various industrial processes) could, in the absence of a clean electricity standard, result in a significant increase in GHG emissions from fossil fuel electricity generation (see sensitivity analysis section).
Current and emerging electricity system technologies needed to meet net-zero GHG emissions
A wide range of technologies are available in Canada to form the electricity system, as described in Table 3.
| Technology | Description | Capital cost ($/kW) | Fixed O&M cost ($/kW) | Variable O&M cost ($/MWh) | Average fuel cost ($/MWh) | Estimated operating lifetime (years) |
|---|---|---|---|---|---|---|
| OGCT | Oil/gas combustion turbine (akin to Brayton cycle) | 1,625 | 20 | 6 | 61 | 45 |
| OGCC | Oil/gas combustion turbine equipped with waste heat recovery system and steam turbine (akin to Brayton cycle plus Rankine cycle) | 1,571 | 26 | 4 | 61 | 45 |
| Small OGCC | Similar to OGCC but with lower generating capacity | 1,737 | 33 | 4 | 61 | 45 |
| NG CCS table a3 note ** | Natural gas combustion turbine (typically OGCC though OGCT is possible), equipped with carbon capture and sequestration technology | 3,310 | 51 | 11 | 61 | 45 |
| OG Steam | Steam turbine (akin to Rankine cycle) generation from oil/gas combustion | 5,239 | 135 | 9 | 56 | 45 |
| Coal | Steam turbine generation from coal combustion | 3,825 | 47 | 3 | 13 | 45 |
| Coal CCS table a3 note ** | Steam turbine generation from coal combustion, equipped with carbon capture and sequestration technology | 8,111 | 95 | 11 | 13 | 45 |
| Biomass | Thermal generation utilizing biomass as fuel | 5,634 | 138 | 10 | 3 | 45 |
| Biomass CCS table a3 note ** | Thermal generation utilizing biomass as fuel, equipped with carbon capture and sequestration technology | 10,485 | 192 | 18 | 3 | 45 |
| Waste | Thermal generation utilizing waste material as fuel | 2,085 | 27 | 8 | 13 | 45 |
| Nuclear | Steam turbine generation utilizing nuclear fission as heat source | 9,120 | 167 | 4 | - | 60 |
| Base Hydro | Hydroelectric projects with little or no storage (akin to run-of-river) | 7,071 | 137 | n/a | - | 100 |
| Peak Hydro | Hydroelectric projects with associated reservoirs, able to generate power during peak demand periods | 7,200 | 49 | 2 | - | 100 |
| Pumped Hydro | Hydroelectric projects that are able to store energy for later use | 7,200 | 49 | 2 | - | 100 |
| Small Hydro | Similar to base hydro but with lower generating capacity | 4,362 | 49 | 2 | - | 100 |
| Onshore Wind | Onshore wind turbines | 2,117 | 51 | - | - | 30 |
| Offshore Wind | Offshore wind turbines | 6,370 | 148 | - | - | 30 |
| Solar PV | Photovoltaic solar panels | 1,825 | 18 | - | - | 30 |
| Geothermal | Thermal generation that utilizes geothermal energy to produce steam | 11,712 | 224 | 7 | - | 30 |
| Wave | Process that utilizes wave motion to generate power | 8,905 | 439 | - | - | 20 |
| Storage | Varying technologies capable of consuming energy in one time period then releasing energy in another time period, with an associated efficiency loss | 1,409 | 11 | 1 | - | 15 |
| Other | Other technologies not covered above | 5,462 | 172 | 7 | 32 | 45 |
Table a3 note(s)
|
||||||
Generally speaking, the electricity system technologies in Table 3 can be categorized into unabated emitting generation, abated emitting generation, non-emitting generation and storage. Certain unabated emitting generation technologies are able to reach lower-emitting profiles by burning “clean fuels” such as renewable natural gas or hydrogen. Abated emitting generation technologies reach lower-emitting profiles by deploying abatement technology such as carbon capture and storage (CCS), which can be purpose-built, or installed in some facilities as a retrofit.
There are also emerging electricity system technologies that may become more widely available in Canada as those technologies continue to develop. For example, fuel cells may offer longer-term energy storage than batteries (months or years versus days or weeks) but are currently underutilized since fuel cell technology is not yet sufficiently efficient relative to batteries. Certain advanced variable renewable generation technologies such as offshore wind and geothermal are set to become more available in the medium term (though subject to geological constraints), as are small modular reactors (SMR) which are designed to be more widely deployable than conventional nuclear due to their compact size. Abated emitting generation, non-emitting generation and storage are all expected to contribute significantly to Canada’s future net-zero electricity system, though some degree of technological development will be required to make that happen.
Objective
The objectives of the proposed Regulations are to
- Help Canada achieve its climate change commitments towards achieving net-zero GHG emissions economy-wide by 2050 by constraining emissions from unabated thermal power generation. This transition will support global efforts to address climate change and help limit associated damage; and
- Reduce GHG (i.e. CO2) emissions from emitting electricity generation beginning in 2035.
Description
The proposed Regulations would achieve emission reductions through the application to electricity generating units of an annual basis emission performance standard of 30 tonnes of CO2 per GWh of electricity produced (30 t/GWh), with limited exceptions.
The proposed Regulations apply to all electricity generation units that meet the applicability criteria. A unit means an assembly of equipment that operates together to generate electricity and must include at least a boiler or combustion engine and may include CCS systems.
Further information on the rationale of the regulatory design can be found in Annex 1.
Application
The proposed Regulations would apply to any unit that meets the three following criteria:
- Uses any amount of fossil fuels to generate electricity;
- Has a capacity of 25 MW or greater; and
- Is connected to an electricity system that is subject to North American Electric Reliability Corporation (NERC) standards (NERC-regulated electricity system).
Registration
The proposed Regulations would require all units that meet the applicability criteria to register with the Minister of the Environment by the end of 2025 or, for units commissioned after January 1, 2025, within 60 days of commissioning.
Emission performance standards
The 30 t/GWh annual average performance standard would apply starting on
- January 1, 2035, for units that combust coal or petroleum coke;
- January 1, 2035, for any unit commissioned on or after January 1, 2025;
- January 1, 2035, for a unit that has increased its electricity generation capacity by 10% or more since registration of the unit;
- On the latter of January 1, 2035, or January 1 of the calendar year in which the prohibition set out in subsection 4(2) of the Regulations Limiting Carbon Dioxide Emissions from Natural Gas-fired Generation of Electricityfootnote 19 begins to apply to a “significantly modified” unit, which is one that has ceased burning coal; or
- For any other unit, the latter of January 1, 2035, or 20 years after its commissioning date.
Only units that are net exporters in a given calendar year are subject to the performance standard in that year. Net exporters generate electricity that is supplied to and in some cases, demand electricity from an electricity system regulated by NERC standards. Therefore, the performance standard would only apply to those units that supply more electricity to a NERC-regulated electricity system than they demand from it.
Exceptions from meeting the 30 t/GWh annual average performance standard
In a given calendar year, a unit could comply with the proposed Regulations using one of the following exceptions to the 30 t/GWh annual average performance standard where all of the conditions related to the exceptions are met:
- A unit, other than one combusting coal, that operates up to 450 hours per year (450 hr/yr) may emit no more than 150 kilotonnes of CO2 per year (150 kt/yr), where for clarity, 450 hr/yr is equivalent to operating 24 hours/day for 18.75 days/year; or
- A unit using CCS may emit no more than an annual average of 40 t/GWh if it can demonstrate that the unit is capable of operating at 30 t/GWh (i.e. documentation showing that the unit operated at or below 30 t/GWh for 2 periods of at least 12 consecutive hours, with at least 4 months between those 2 periods in a given calendar year). This exception is only available until the earlier of 7 years after commissioning of a carbon capture and storage (CCS) system or December 31, 2039.
If all of the conditions related to the exceptions are not met in a given calendar year, then the 30 t/GWh annual average performance standard must be complied with in that year.
Furthermore, the proposed Regulations would allow any unit subject to them to operate during any period of emergency circumstance without being required to meet the performance standard during such a period if the unit has been provided an exemption to do so by the Minister of the Environment. In general, an emergency circumstance is one that arises due to an extraordinary, unforeseen, and irresistible event.
Quantification
The proposed Regulations would set out the manner for determining compliance with the performance standard in a calendar year. In general, for each unit, an operator would need to determine the unit’s emissions intensity, which is the unit’s total emissions divided by its total generation. The quantification requirements apply to each unit annually, as of the calendar year that the prohibition first applies to the unit, regardless of whether the unit is subject to the prohibition in a calendar year,
The unit’s total generation is the quantity of electricity it generated during the course of a year measured on a gross basis.
The unit’s total emissions, which can be determined using either a fuel-based method or continuous emissions monitoring systems (CEMS), includes as applicable
- The quantity of emissions produced by the combustion of fossil fuels for electricity generation; and
- The quantity of emissions associated with the production of any hydrogen fuel or steam that is used by the unit to produce electricity, regardless of the location or supplier.
For clarity, in cases when hydrogen is used as a fuel in the electricity generating unit, the combustion of that hydrogen does not directly produce any CO2 emissions from the unit; therefore, any CO2 emissions associated with the hydrogen’s production must also be quantified and included in the unit’s total emissions.
As included in the proposed Regulations, the unit’s total emissions can exclude the quantity of emissions captured by its CCS system only if these emissions are permanently stored in a storage project that meets prescribed criteria.
Reporting
The proposed Regulations would require all units that meet the applicability criteria to submit a registration report that includes information such as identification of the responsible person; the location and name of the unit; a process diagram of the unit, including the commissioning date of each boiler or combustion engine; the commissioning date of the unit and the unit’s electricity generating capacity.
On an annual basis, the proposed Regulations would require all units that have net exports to an electricity system subject to NERC standards to submit a report that includes information such as the unit’s annual average emission intensity; if applicable, in the case of units with a CCS system installed in the last 7 years, documentation demonstrating that the unit operated at or below 30 t/GWh for 2 periods of at least 12 continuous hours in the reporting year; gross generation; emissions and hours of operation.
A declaration of no net exports may be provided for a unit that does not expect to have any net exports from the time the performance standard would begin to apply to that unit, which would reduce its reporting requirements. If these units never have net exports to the electricity system, they will remain exempt from the prohibition and the quantification requirements in the proposed Regulations.
All units would be required to track their net exports as the performance standard would apply from the applicable year (as of 2035) for that unit if there are net exports in that year. These units would also be subject to quantification rules from the applicable year.
The Regulations Designating Regulatory Provisions for the Purposes of Enforcement (Canadian Environmental Protection Act) would be amended to include the proposed Regulations and make the contravention of applicable rules punishable by appropriate penalties, such as increased fines and jail time.
Regulatory development
Consultation
The Department of the Environment (the Department) started consultations with interested parties to the proposed Regulations in March 2022. Interested parties include utility companies, provincial and territorial governments, Indigenous groups, industry associations, environmental non-governmental organizations (ENGOs), unions and labour organizations, researchers and academics in the field of climate change or energy and the general public.
Starting with the Clean Electricity Standard Discussion Paper, which laid out the Department’s initial proposal on how to achieve a transition to net-zero electricity and introduced the key components that any such policy should incorporate, namely emission reductions, electricity affordability and electricity system reliability. In its proposal, the Department noted that implementing the proposed Regulations would require careful balancing of these three criteria, as maximizing outcomes for any one criterion could place achieving either of the other two at risk. For example, maximizing affordability could endanger emission reductions as the cheapest option to keep the electricity system operating in many places is to continue using existing natural gas-fired generation. In the same way, maximizing reliability may hinder emission reductions as reliability in the status quo requires having sufficient natural gas generation available. An electricity system that is neither affordable, nor reliable could discourage the transition to clean electricity generation needed to achieve the economy-wide net-zero target in 2050.
Interested parties’ engagement
- On March 15, 2022, interested parties were invited to submit comments on the Clean Electricity Standard Discussion Paper which laid out the proposed regulatory approach towards supporting net-zero GHG emissions in the electricity sector by 2035.
- On March 23-24, 2022, interested parties were invited to attend an ’Opening the Loop’ informational webinar on the Discussion Paper. Over 160 submissions were received, following which, a webinar was held on July 21-22, 2022, with a focus on these comments.
- A second round of engagement and consultation began on July 26, 2022, with the publication of the Proposed Regulatory Frame for the Clean Electricity Regulations (“the regulatory frame”) which provided more specifics on the proposed regulatory design. Over 120 submissions were received on the regulatory frame.
- A third webinar was held on September 13-14, 2022, with a focus on modelling assumptions. A number of bilateral modelling sessions were held with various provinces to ensure that the assumptions used in federal modelling were correct.
- On October 3, 2022, an Indigenous information session was hosted, with attendees from First Nations, or their representatives.
As of December 2022, nearly 100 bilateral meetings were held with interested parties to further discuss and provide feedback on the approach of the proposed Regulations.
Following these consultations, more than 330 submissions on the proposal were received. Interested parties commented on
- the role of natural gas and liquid-fired electricity generation post-2035 to ensure reliability of electricity systems;
- the treatment of emitting forms of industrial electricity generation;
- the potential for adverse impacts on electricity rates; and
- the readiness of emerging non-emitting technology to supply reliable electricity by 2035, specifically the availability of generation and storage technologies.
Interested parties have also voiced general support for de-carbonizationfootnote 20 of the electricity system and a willingness to engage in the development of the proposed Regulations to ensure that the regulations would achieve the necessary emissions reductions while maintaining affordability and reliability.
In general, feedback on the proposed Regulatory Frame for the Clean Electricity Regulations (July 26, 2022) was positive, in that many interested parties viewed the proposed regulatory frame as a workable approach to achieving net-zero. However, interested parties raised specific concerns, discussed below, that the Department has considered in depth while developing the proposed Regulations.
Interested parties’ concerns
Natural gas and liquid fuel fired electricity generation post-2035
Many utility companies voiced concern that electricity system operators would not be able to maintain reliability without at least some operation post-2035 from the types of generators that are currently powered by natural gas, or liquid fuel because they are flexible and highly controllable. Many voiced support for an exemption that would allow system operators to use these generators to maintain reliability, as long as it is on a time and emissions-constrained basis.
ENGOs, non-emitting power producers and sustainable industry representatives voiced that the role for natural gas and liquid fuel to power electricity generation should be minimal after 2035 and that a requirement that would limit the use of natural gas would reduce emissions to as close to zero as possible.
To address interested parties’ concerns, the Department has built emissions constrained flexibilities for natural gas and liquid fuel generation into the proposed Regulations to:
- Phase in the performance standard on existing units by applying the standard to any given unit 20 years following its commissioning date, known as a unit’s End of Prescribed Lifefootnote 21 (EoPL);
- Allow covered units to operate in the event of emergency situations without having to meet the performance standards;
- Allow covered units to operate during peaking periods under a total emissions threshold (rather than emissions intensity) and total time limit in a given year without having to meet the intensity-based performance standard; and
- Set the performance standard at a level (i.e. 30 t/GWh) that could be met by natural gas units with CCS so that these units can supply flexible and highly controllable generation to electricity systems.
- Furthermore, the proposed Regulations would allow covered units that are using CCS as part of a compliance strategy to meet an annual average emission intensity of 40 t/GWh for the first 7 years following the capture system’s commissioning, or until December 31, 2039, whichever comes first.
A few utility companies cautioned against allowing too much flexibility for natural gas generation, as this could discourage the rollout of non-emitting generation and energy storage. Furthermore, ENGOs voiced concern that any role for non-emergency gas-fired electricity generation should be greatly limited after 2035. These parties cautioned against underestimating the ability of technologies such as energy storage, hydrogen, CCS, nuclear and other non and low-emitting emerging technologies to ensure electricity system reliability by 2035.
The time limitations incorporated into the above four compliance flexibilities could limit the use of unabated natural gas and liquid fuels for electricity generation in the post-2035 period. It is expected that this would lead to increasing use of non- and low-emitting generation sources.
Higher emitting provinces, utilities, system operators and power producers requested flexibility in the application of the performance standard. Specifically, they shared their concern that, without flexibility, there would be insufficient natural gas capacity to backup variable renewables (e.g. wind and solar) and that units now under construction may not be commissioned in time (by 2025) to benefit from the existing unit EoPL described above.
To address this concern, the proposed Regulations include flexibilities that would
- allow covered units to operate in the event of emergency circumstances; and
- allow covered units to operate if meeting both a total emissions threshold and total time limit in a given year (e.g. mass-based exception to 30 t/GWh performance standard).
ENGOs and industry operating in the clean technology space were seeking clear signals that the proposed Regulations would require electricity system operators to dispatch non-emitting sources in advance of emitting ones. In consideration of these comments, the Department noted that the reliability of electricity systems are of critical importance for provinces and territories, as they are responsible for designing and operating electricity systems. The proposed Regulations set a stringent performance standard, but maintain technology neutrality, allowing provinces and territories, or electricity system operators to choose what types of generation to procure.
Many ENGOs asked for the inclusion of interim standards (i.e. applying a standard before 2035) to avoid a build-out of new natural gas generation before the performance standard applies in 2035. Interim standards are not proposed for the following reasons:footnote 22
- As new natural gas units represent a substantial investment that can only be recouped after 10 or more years of operation, the Department expects that by setting a standard of 30 t/GWh starting in 2035, new units built before 2035 would nonetheless be designed to meet the 30 t/GWh standard so that they could continue to operate past 2035.
- Most of the natural gas units that will come online before 2025 were planned before the proposed Regulations were announced. Few units could be conceived, designed and built before January 1, 2025, the date at which units are counted as “new” under the proposed Regulations and therefore cannot benefit from the 20-year EoPL.
- As an alternative to complying with the 30 t/GWh performance standard, units can instead operate at any emissions intensity for a maximum of 450 hours per year, with a limit of 150 kt/yr, to provide back-up or peaking capacity. It could be possible to commission a new unabated unit after 2025 that could operate under these provisions. This has benefits for geographical regions in Canada that do not have access to the deep geological storage needed for installing CCS technologies. However, it is expected that it would be less financially favourable to only operate a new unit for such a limited amount per year, which would limit the commissioning of new unabated units for this purpose. Furthermore, the total emissions of these units would be less than if they were to operate under the 30 t/GWh emissions standard.
Treatment of industrial emitting electricity generation
Many ENGOs and some utilities shared their concern that there could be a large build-out of industrial electricity generation “behind-the-fence”footnote 23 in order to avoid the proposed Regulations, since electricity units that are not connected to a NERC-regulated electricity system would not be covered under the proposal.
Upon review, the Department noted the following:
- The proposed Regulations are designed to target emissions from the electricity sector. Industrial emissions are subject to other policies, such as carbon pricing.
- The proposed Regulations would cover all generation units that are connected to a NERC-regulated electricity system, regardless of whether or not the units are physically located “behind-the-fence,” i.e. units located at an industrial site.
- In any given compliance year, industrial units that have net exports to a NERC-regulated electricity system (i.e. they sell more electricity than they buy) would have to meet the proposed Regulations’ performance standard in that year. This will create a co-benefit because even electricity produced by units with net exports but used to meet on-site electricity demand would have to meet the 30 t/GWh performance standard. This means that only electricity produced by units that do not have net exports to the electricity system would not have to meet the performance standard.
- Emissions from electricity generation facilities are covered by the Output-Based Pricing System Regulations (OBPSR) or the applicable provincial or territorial carbon pricing system. This means that emissions from units that do not have net exports to a NERC-regulated electricity system in a given year will still be exposed to a price signal to reduce emissions.
- Currently, there are not sufficient, cost-effective low, or non-emitting alternatives for wholly “behind-the-fence” generation. In this context, covering “behind-the-fence” fossil-fired generation units under the proposed Regulations when these units are not net exporters of electricity to a NERC-regulated electricity system would result in negative impacts to industry that would not otherwise occur under the other policies described above (e.g. carbon pricing). Furthermore, “behind-the-fence” units would need to be addressed as Canada moves towards a net-zero economy in 2050.
- In some cases, the fuels that are used in “behind-the-fence” generation would otherwise be required to be flaredfootnote 24 if they were not used for electricity production. As such, if the proposed Regulations were to cover “behind-the-fence” units, it is likely that many of the units would opt to avoid regulatory coverage by ceasing to produce electricity from these fuels and instead flare them. In such scenarios, emissions would increase from the flaring activity without any realized benefit (i.e. electricity generation) from the fuels’ combustion.
For the above reasons, the proposed Regulations would not apply to “behind-the-fence” units that do not have net exports to the grid.
Potential adverse impacts on electricity prices
Some provinces and utilities voiced concerns about the costs of complying with the proposed Regulations and the potential impacts on rate affordability for households, businesses and industry. They noted that fossil-fuel reliant electricity systems would bear higher costs in the net-zero transition than electricity systems that have substantial non-emitting resources, e.g. wind. These interested parties requested funding programs, tax measures and other incentives to minimize the short-term costs of the transition. In particular, provincial governments of New Brunswick and Nova Scotia raised that these provinces experience higher rates of energy povertyfootnote 25 in the country and noted concern that the proposed Regulations could exacerbate this problem.
The Department notes the following:
- Specific engagement was held regarding the analysis of the expected effect on the price of residential electricity.
- Separate from the proposed Regulations and their objectives, the Government of Canada has announced, developed and implemented complementary measures, including funding, to help support the net-zero transition, thereby indirectly reducing the proposed Regulations’ impact on electricity prices.
- The proposed Regulations would include flexibilities that help utilities manage the cost impact of their electricity system while maintaining reliability.
- The Department engaged with a number of academics with expertise in the economics of the electricity system to understand the potential impacts of the proposed Regulations on electricity affordability, which informed the establishment of the regulatory standards and flexibilities within the proposed Regulations. This engagement will continue as the Department considers comments received during the prepublication period.
Readiness of emerging non-emitting technology to supply reliable electricity by 2035
A few utilities, ENGOs, companies operating in the clean technology space and some academics cautioned against allowing too much flexibility for natural gas generation, as this could discourage the rollout of non-emitting generation and energy storage. These parties cautioned against underestimating the ability of technologies such as energy storage, hydrogen-ready gas turbines, CCS, nuclear and other non- and low-emitting emerging technologies to ensure electricity system reliability by 2035.
Several provinces and territories noted that CCS is not a decarbonization option for them because their geology does not allow for carbon storage. Several provinces and territories expressed concern over the readiness of key decarbonization technologies such as CCS, SMR and energy storage, noting that their costs will be very high even when ready for wide-scale deployment. Experts in CCS technology noted that while the 30 t/GWh performance standard is achievable by these systems, there may be periods in the early years of deploying these systems when some adjustments to the systems may be needed in order for them to achieve the performance standard consistently.
The Department notes the following:
- New investments in the development and deployment of emerging technologies such as CCS, energy storage and SMR are anticipated.
- Compliance flexibilities such as prescribed life for units commissioned before January 1, 2025, or the mass-based emission/duration exception allow for continued operation of natural gas and liquid-fired generation in these periods.
- The proposed Regulations contain an exception that allows a covered unit having CCS technology to operate at an average emission intensity of 40 t/GWh if the unit can prove that it is capable of operating at or below 30 t/GWh (i.e. documentation showing that the unit operated at 30 t/GWh for two periods of at least 12 consecutive hours, with at least 4 months between those two periods in a given compliance year) and that:
- The unit can only use the exception for up to 7 years following the commissioning date of that CCS system or until December 31, 2039, whichever comes first.
- During this 7-year period, a unit whose CCS system cannot achieve 30 t/GWh on an annual average basis can continue to operate while the person responsible for the unit undertakes the actions required to improve the unit’s emission performance to meet the 30 t/GWh standard on an annual average basis. These actions could involve multiple rounds of emissions testing, assessing the CCS system for its performance fault, designing the solution to allow for 30 t/GWh operation, building/implementing this solution and commissioning it. Based on the timelines associated with major retrofits of electricity generating units, it is expected that 7 years would provide ample time to take the actions required to improve the CCS system’s performance. By 2040, it is expected that CCS systems will have improved to the point that this flexibility would no longer be needed.
- The CCS exception ensures that the CCS systems are designed to meet an ambitious carbon capture rate, while allowing some minor flexibility in case operational circumstances made it difficult to initially achieve this rate consistently.
Modern treaty obligations and Indigenous engagement and consultation
As required by the Cabinet Directive on the Federal Approach to Modern Treaty Implementation, an assessment of modern treaty implications was conducted for the proposed Regulations. The assessment examined the geographic scope and subject matter of the proposed Regulations in relation to modern treaties in effect. The assessment did not identify any modern treaty implications or obligations.
The Department has taken a distinctions-based engagement approach with Indigenous Peoples:
- Inviting representatives of National Indigenous Organizations (NIOs) to informational webinars;
- Meeting bilaterally with NIOs and extending an open offer to continue meeting on a bilateral basis; and
- Hosting a specific webinar for First Nations to hold a conversation about the proposed Regulations.
Indigenous interested parties have identified energy affordability as a concern that is becoming more acute and recommended that the design of the proposed Regulations protect electricity affordability. Some also expressed that there is strong Indigenous awareness about the impact of health risks from burning fossil fuels and an interest in understanding the benefits of reduced air pollutants that the proposed Regulations could create.
The Department notes that
- Separate from the proposed Regulations and their objectives, the Government of Canada has announced, developed and implemented complementary measures to help support the transition, including funding, that is either targeted for Indigenous-led projects or is available to Indigenous-led projects, thereby indirectly reducing the proposed Regulations’ impact on rates;
- The proposed Regulations would include flexibilities that help utilities manage the cost impact of their electricity system while maintaining reliability;
- The Department has engaged with Indigenous-led organizations with insight into energy affordability in Indigenous communities in order to understand the potential impacts of the Regulations on electricity affordability. This engagement will continue during development of the Regulations; and
- The potential health benefits of the proposed Regulations are discussed further in this regulatory impact analysis statement.
The Department also heard about intersections between the proposed Regulations and broader concerns surrounding economic reconciliation and the participation of Indigenous Peoples in the clean energy transition, particularly through economic participation.
In addition to the above considerations, the Department has reviewed all questions and comments received from Indigenous interested parties and will continue to consider them in the development of the proposed Regulations. Some issues being raised, including Indigenous communities’ views on the energy transition and economic participation, are of interest not just in the context of the proposed Regulations, but also for the broader clean electricity transition.
Instrument choice
The Cabinet Directive on Regulation (CDR) requires departments and agencies to assess the full suite of instruments available (both regulatory and non-regulatory) under federal acts and regulations to select the most effective and appropriate instrument or mix of instruments to address a policy issue. Considering the urgency to address climate change and Canada’s climate change goals towards becoming a net-zero GHG emissions economy by 2050, a transformational change will be required in every sector of the Canadian economy including the electricity-generating sector.
Transforming electricity systems must occur much earlier than 2050, since it requires growth of electricity supply to support the use of more electric technologies, such as electric transportation, heating and cooling of buildings, solutions for various industrial processes and that the electricity generated results in net-zero GHG emissions. If this transformation is not under way by 2035 there is a risk that Canada may not meet its climate change goals of becoming a net-zero GHG emissions economy by 2050.
In determining the most effective and appropriate instrument or mix of instruments that would ensure the electricity-generating sector is on a path to achieve the required transformation by 2035, the Department considered the current federal regulatory regime affecting the sector in the baseline scenario (status quo), including non-regulatory actions. It was determined that the current federal regulatory regime does not ensure that the sector would achieve the required transformation by 2035 and therefore federal regulations would be required. A summary of this assessment is given below:
Baseline scenario / no new controls
The baseline scenario approach involves maintaining existing restrictions on emissions of coal-fired electricity as set out in the Reduction of Carbon Dioxide Emissions from Coal-fired Generation of Electricity Regulations, which generally set a performance standard of 420 t/GWh. In addition, the baseline scenario approach involves maintaining existing restrictions on emissions of natural gas electricity generation set out in the Regulations Amending the Reduction of Carbon Dioxide Emissions from Coal-fired Generation of Electricity Regulations. These latter Regulations set an emission intensity standard of 420 t/GWh for natural gas boilers or combustion engine units that are 150 MW and greater and an emission intensity standard of 550 t/GWh for combustion engine units that are under 150 MW.
As of 2030, electricity generation capacity from gaseous fuel that meets specified criteria and that was put in place on or after January 1, 2021, whether at an existing or new facility, would be fully exposed to the carbon price. Any such electricity generation capacity that existed prior to 2021 would be subject to the carbon price only for the portion of GHG emissions above the OBS of 370 t/GWh. In the baseline scenario, unabated natural gas generation and associated GHG emissions would be expected to rise in future years as more electric technologies are implemented (e.g. electric transportation) in Canada. This would limit the ability for Canada to achieve net-zero GHG emissions economy-wide by 2050. Most electricity generating facilities are subject to carbon pollution pricing under the federal Output Based Pricing System Regulations (OBPSR), or under provincial or territorial systems that meet the federal benchmark (i.e. the minimum national stringency criterial that all carbon pricing systems in Canada must meet). Under the OBPSR, electricity generation facilities that are covered under the federal system must provide compensation for GHG emissions that are above their facility emissions limit. Compensation can be provided by paying the excess emissions charge ($65/tonne of CO2e in 2023, increasing to $170/tonne in 2030), or by providing one compliance unit (surplus credit, offset credit or recognized provincial offset credit) for each tonne of emissions above their limit. If emissions are below their limit, facilities receive surplus credits for the quantity between the actual emissions and the emissions limit, which can be sold or banked to meet future compliance obligations.
Under the OBPSR, emissions limits are calculated by multiplying a facility’s production by the relevant output-based standard (OBS) associated with the activity, which can be considered a free allocation. Electricity generation is subject to different OBSs based on fuel type. For solid fuel, the OBS started at 800 t/GWh in 2019 and will decrease to 370 t/GWh in 2030. For liquid fuel, the OBS is 500 t/GWh and for gaseous fuel, the OBS is 370 t/GWh. In addition, gas-fired electricity generation facilities that start generating electricity on or after January 1, 2021, and that meet certain size and other designed requirements have an OBS of 370 t/GWh in 2021 decreasing to 0 t/GWh in 2030. This means that in 2030, new gaseous electricity facilities would have no free allocation and would therefore pay for 100% of the GHG emissions emitted from the facility. Modelling by the Department indicates that electricity sector emissions would not decrease sufficiently so as to meet the objectives of the proposed Regulations and could, in fact, increase significantly in the coming decades.
The Government of Canada has core infrastructure investment programs that focus on clean energy system infrastructure with total combined investments of nearly $10 billion. This includes programs such as the Smart Renewables Electrification Pathways Program (SREP), a $1.57 billion program, including $600 million announced in Budget 2022, that provides support for smart renewable energy and electrical grid modernization projects, including projects that support capacity building. From December 2021 to February 2023, the SREP provided funding for about $164.5 million.footnote 18 In Budget 2023, the Government of Canada announced an increase in funding of $3 billion for the SREP.
The Government of Canada provides low-interest financing to clean electricity projects through a variety of mechanisms, including investments and financing from the Canada Infrastructure Bank (CIB) and Strategic Innovation Fund, as well as federal tax incentives. These initiatives total more than $20 billion. This includes the Canada Growth Fund ($15 billion to fund investments in support of a net-zero GHG emissions economy) and funding for the clean power sector announced in Budget 2023 through the Canada Infrastructure Bank ($10 billion through the clean power priority area for building of major clean electricity).
The Government of Canada expects that these investment programs will be of critical importance, as they would work in tandem with the proposed Regulations to help achieve Canada’s goals of transforming the electricity system by 2035 to help achieve a net-zero emissions economy by 2050.
Using carbon pricing to reduce electricity sector emissions
Currently, the minimum national stringency criteria for carbon pricing systems (the federal benchmark) require that explicit carbon price-based systems, such as the federal Output-Based Pricing System, be designed such that the marginal price signal is equal to the benchmark price but allows systems to apply lower average carbon costs to industrial facilities to mitigate carbon leakage and competitiveness risks that can arise due to carbon pricing. Systems do this by requiring facilities to pay the carbon price for emissions above an emissions limit and issuing tradeable credits for facilities that emit below that limit. This approach creates a price signal at the benchmark price on every tonne of emissions but because facilities don’t have to pay the carbon price on all of their emissions, it reduces average carbon costs and risk of carbon leakage and adverse competitiveness impacts.
Reducing GHG emissions from the electricity sector could be achieved by ensuring that a high carbon price is paid for every tonne of electricity emissions. If electricity generators had to pay the carbon price for every tonne of emissions, their average carbon costs would increase. The Department has conducted various modelling exercises and determined that a carbon price of $170/tonne applied to every tonne of electricity sector emissions does not move the sector far enough towards net zero by 2035. Furthermore, in a high-demand modelling scenario, a carbon price of $170/tonne was not found to be sufficiently high so as to make near-zero emission electricity generation technologies significantly more competitive than emitting technologies; if non-emitting and near-zero emission generation technologies are not the most cost competitive options, it is expected that sector emissions would increase. Therefore, while requiring the carbon price to be paid on every tonne of emissions from electricity generation would be expected to achieve additional emission reductions, it would not achieve reductions to the extent needed to achieve the required emission reductions towards net-zero by 2035.
Moreover, the carbon pollution pricing systems in Canada are an economy-wide tool that provides a strong price incentive to reduce emissions in the most cost-effective manner across all emission sources it covers. It provides this strong incentive by its design, which does not set specific limits for emissions from individual sectors. They do not guarantee a certain level of reductions from a specific sector and as such, are not the right tool to ensure achievement of the objective of a net-zero electricity sector.
In the absence of a regulated standard, it is likely to be more economic for utilities to (i) continue to use unabated natural gas to generate reliable baseload power and pay an increased price on pollution, or (ii) to acquire and remit surplus or offset credits. In the absence of other constraints, this would be the choice generators would likely make rather than transition their generating equipment to produce reliable, near-zero emission electricity through technological solutions like wind or solar coupled with energy storage or natural gas coupled with modern CCS technology. Overall, analysis by the Department indicates that requiring electricity generators to pay a high carbon price on all of their emissions would not be sufficient on its own, to guarantee that the electricity sector would achieve by 2035, the transformation required to support Canada’s climate change goal of becoming a net-zero GHG emissions economy by 2050.
The proposed regulatory approach
Reducing GHG emissions to transition towards a net-zero electricity system and to support a net-zero emissions economy by 2050 would require a planned and permanent transition away from unabated electricity generation. The proposed Regulations would build on the existing regulatory framework for the electricity sector to continue progress towards the permanent transition away from unabated fossil-fired electricity generation to low or non-emitting sources of generation. Significant progress in this direction could be accomplished through the application of stringent performance standards within the 2035 time frame. The proposed performance standard would require fossil fuel-fired generation to be abated in order to provide baseload generation. This approach would also provide a clear regulatory reference point that lays out what would constitute clean electricity, while providing power producers with timelines adequate to adjust their capital investment plans. However, given that the proposed performance standard would be set at a non-zero value and that the proposed regulatory approach would include several compliance flexibilities, the electricity generation sector would continue to have low levels of residual emissions. Additional actions would be needed before the electricity generation sector could fully achieve net-zero emissions.
Within the proposed regulatory approach, the Department considered several options for key parameters including the emissions performance standard, compliance flexibilities, capacity threshold, industrial generation coverage and an End of Prescribed Life. The impacts of varying these parameters are assessed in the sensitivity analysis section of the RIAS.
Regulatory analysis
Benefits and costs
Data sources and analytical parameters
A cost-benefit analysis (CBA) is undertaken to determine the incremental impacts (costs and benefits) accrued under a regulatory scenario relative to those accrued under a baseline scenario. For this proposal, the CBA compares the difference in impacts between a scenario with the proposed Regulations and a scenario without them. The main driver of incremental impacts for the proposed Regulations is the electricity system mix modelled in the baseline scenario versus that modelled in the regulatory scenario. In the CBA, electricity system mix refers to the set of infrastructure that makes up the electricity system (e.g. non-emitting generation assets, abated emitting generation assets, emitting generation assets, storage assets and transmission lines that connect between electric utility systems), the technical specifications of that infrastructure (e.g. capacity, generation, fuel usage, emissions intensity, operation and maintenance factors) and the usage of that infrastructure (e.g. electricity system only generation, industrial generation, back-up or emergency generation). Under the proposed Regulations, Canada’s electricity system mix would shift towards low or non-emitting sources of electricity generation more quickly and to a greater extent than it would under the baseline scenario and there would be greater investment in storage and transmission capacity.
The electricity system mix and related factors that could be realized under a baseline scenario versus under a regulatory scenario were projected by two departmental models. The first model is NextGrid, which is a capacity expansion model that identifies optimal investment and operation decisions across Canada’s electricity system, minimizing the system-wide (national) cost of meeting demand subject to many constraints including policy parameters, system reliability and resource availability (e.g. geological constraints). The second model is the Energy, Emissions and Economy Model for Canada (E3MC), which itself contains two components. The first component of E3MC is Energy 2020 (E2020), which is an integrated, multi-region, multi-sector North American model that simulates the supply, price and demand for all fuels. E2020 estimates energy output and prices for each sector in regulated and unregulated markets and simulates how energy prices and government measures may affect the choices that consumers and businesses make when they buy and use energy. E2020’s outputs include changes in energy use, energy prices, greenhouse gas emissions, air pollutant emissions, investment costs and possible cost savings from measures, which are used to identify the direct effects stemming from measures aimed at reducing GHG emissions. The resulting savings and investments from E2020 are then used as inputs into the second component of E3MC, The Informetrica Model (TIM). TIM is used to examine consumption, investment, production and trade decisions in the whole economy. It captures the interactions among industries, as well as the implications for changes in producer prices, relative final prices and income. It also factors in government fiscal balances, monetary flows and interest and exchange rates. TIM projects the direct impacts on the economy’s final demand, output, employment, price formation and sectoral income that result from various policy choices. These, in turn, permit an estimation of the effect of climate change policy and related impacts on the national economy.footnote 26
NextGrid and E3MC are capable of modelling electricity system mixes in Canada out to 2050 and base their results on optimization algorithms and constraints that are distinct to each model, utilizing data from a multitude of sources including Statistics Canada and ongoing collaboration with provinces and utilities. To the extent possible and where appropriate, underlying assumptions and application of the proposed Regulations have been aligned between E3MC and NextGrid to produce results from both models that can be used in tandem throughout the CBA. In the CBA, electricity system mix in the baseline scenario was modelled by E3MC, while electricity system mix in the policy scenario was modelled by NextGrid and E3MC. Specifically, NextGrid modelled the decisions that may be made by existing units that do not meet the CO2 emissions intensity limit starting in 2035 (i.e. retire early, retrofit with CCS, or change operation regime to operate under the mass-based emission/duration flexibility), while E3MC modelled the decisions that may be made by all other units. NextGrid was also used to model and cost out new interprovincial transmission lines that may be constructed in the regulatory scenario. Aside from those transmission lines, all other electricity system and economy-wide cost inputs used in the CBA were derived by E3MC. The CBA uses outputs from E3MC and NextGrid to present a distribution of impacts deemed attributable to the proposed Regulations, while acknowledging a variety of external economic and environmental changes that may occur over the analytical period by using conservative assumptions where appropriate and by testing alternative parameters in sensitivity analysis.
It is important to note that the proposed Regulations do not prescribe any particular compliance pathway onto any particular unit that does not meet the CO2 emissions intensity limit starting in 2035. All results presented in the RIAS represent a modelled scenario indicating what may occur in response to the proposed Regulations based on reasonable constraints and assumptions (i.e. central case modelling). The central case scenario does not represent the only path that the electricity-generating sector could take to comply with the regulatory requirements and should not be interpreted as being more probable than other potential paths. Likewise, it is important to acknowledge the vast degree of uncertainty when modelling structural changes associated with economic decarbonization over a long-time horizon. A wide range of outcomes are ultimately possible, which could be driven by new or unanticipated technological development, alongside macroeconomic factors, demographic shifts and policy landscapes at all levels of government that may fundamentally alter baseline modelling.
Under the proposed Regulations, certain administrative costs to industry would begin in 2024 upon anticipated registration of the Regulations. Results from E3MC indicate that changes to Canada’s electricity system mix and associated changes to system costs could begin as early as 2026 in anticipation of the CO2 emission intensity limit coming into force starting in 2035. Because of this and Canada’s goal to achieve net-zero emissions by 2050, the analytical time frame chosen for the CBA is 2024 to 2050 (a 27-year period). Unless otherwise stated, all costs and monetized benefits are presented in 2022 constant dollars, discounted to base year 2023 at a discount rate of 2%. This is the near-term Ramsey discount rate now utilized by the Government of Canada when monetizing GHG reductions and is informed by the most current state of climate science (more information on this approach is presented in the benefits subsection). In all tables that follow, totals may not add up due to rounding.
Key modelling assumptions in the CBA
Some electricity generating units produce electricity for industrial use “behind-the-fence” (i.e. within an industrial facility). A subset of these industrial generation units sell a portion of the electricity they generate to a NERC-regulated electricity system. Under the proposed Regulations, any unit greater than or equal to 25 MW capacity that is connected to a NERC-regulated electricity system and is a net exporter of electricity as of 2035 (or the relevant compliance year) must comply with the 30 t/GWh annual CO2 emission intensity standard, unless it meets all of the conditions related to one of the exceptions. The CBA modelling assumes that all industrial generation units with net exports to the electricity system in the baseline scenario would undertake the emission reduction related investments necessary to continue selling a portion of the electricity they generate to the electricity system in the regulatory scenario. By extension, the proportion of electricity that these industrial units produce for use “behind-the-fence” would also meet the CO2 emission intensity standard. In the CBA, emissions reductions attributable to generation sold to the electricity system (from electric utilities and industrial generation units) are considered main benefits, while emissions reductions attributable to generation used “behind-the-fence” are considered co-benefits. By contrast, the CBA makes no distinction for costs incurred by electric utilities versus industrial generation units, in recognition that any investment that would be undertaken to meet the CO2 emission intensity standard is considered a direct cost of the proposed Regulations regardless of where the generated electricity is ultimately used. Industrial generation units that are not connected to a NERC-regulated electricity system and only generate electricity for use “behind-the-fence” are not subject to the proposed Regulations and are therefore out of scope of the CBA.
For the purposes of analysis, the Department modelled into the baseline scenario, interprovincial transmission lines (or interties) including those that are not yet constructed (e.g. the Atlantic Loop). Regional interties are considered to be a key compliance strategy for coal-dependent provinces to meet the requirements of the Reduction of Carbon Dioxide Emissions from Coal-fired Generation of Electricity Regulations as amended in 2018, and are not considered incremental to the proposed Regulations. Modelling indicates that regional interties in the Atlantic region are the lowest cost option of complying with the proposed Regulations.
The baseline scenario also includes federal funding policies and programs related to electricity system infrastructure investments. Specifically, the baseline scenario accounts for an abstraction of the Investment Tax Credit (ITCfootnote 27) for Clean Technology that was announced in the 2022 Fall Economic Statement, by reducing the marginal capital cost of greenfield construction (per MW) of qualifying technologies by 30% in 2023 through to 2031, then phasing the credits out linearly from 2032 to 2035. The modelled ITC affects the relative cost that industry faces to construct qualifying non-emitting electricity system technologies versus emitting electricity system technologies, thereby increasing the attractiveness of investments in non-emitting capacity in the baseline scenario relative to what it has been historically. The modelled ITC was applied to nuclear, pumped hydro, small hydro, onshore wind, offshore wind, solar PV, wave and storage, but not to emitting technologies that implement a CCS system. The central case modelling did not incorporate the full range of federal supports that will become available to the electricity generation sector in Canada. As more details around the new Clean Electricity ITC and its application become available, alongside additional new measures announced in Budget 2023, the final design of the Clean Technology ITC, the ITC on CCS and any future federal funding decisions (e.g. SIF NZA), future central case modelling would be adjusted to align with that treatment. Such federal funding decisions are expected to reduce the scale of incremental impacts assessed for the proposed Regulations (i.e. lower costs and lower benefits), as additional actions to reduce GHG emissions in the electricity generation sector would be expected to occur in the baseline scenario.
Rates in Nova Scotia and New Brunswick are expected to increase in the future under the baseline scenario. In addition to measures included in the 2022 Fall Economic Statement and Budget 2023 that support the decarbonization of electricity, the federal government has offered funding to build out transmission lines that will contribute to the efforts to mitigate impacts on electricity rates in the region. Reducing the expected rate increases under the baseline scenario also lowers the proposed Regulation’s overall impact on rates.
From a CBA perspective, it is worth noting that any government expenditure with respect to federal funding incentives would constitute a cost transfer from industry (and by extension, consumers of electricity) to the general tax base. The central case modelling accounts for incremental uptake of federal funding by first projecting the electricity system mix that would be constructed in the baseline and regulatory scenarios with the modelled ITC in place, then determining the incremental government expenditure associated with those investments.
Electricity system mix
Canada’s electricity system mix can be characterized on two bases: capacity and generation. Capacity refers to the amount of electricity a unit is capable of generating (e.g. installed capacity expressed in MW), whereas generation refers to the actual amount of electricity generated by a unit (e.g. capacity utilization expressed in GWh). Generating units are not always operated at full capacity. For example, a wind unit would generate below its capacity when wind speeds are low and a back-up unit would only generate at capacity when required for reliability. E3MC modelling indicates that Canada’s electric utility sector (excluding all industrial generation units) would take on the following capacity characteristics in the baseline scenario (Table 4) versus in the regulatory scenario (Table 5):
| Technology type | 2025 | 2030 | 2035 | 2040 | 2045 | 2050 |
|---|---|---|---|---|---|---|
| Emitting table c1 note * | 17.9% | 16.4% | 14.1% | 13.4% | 12.9% | 12.6% |
| Emitting with CCS | 0.1% | 0.1% | 0.3% | 0.4% | 0.5% | 0.5% |
| Nuclear | 8.8% | 6.1% | 5.1% | 4.8% | 4.6% | 4.3% |
| Hydro | 53.1% | 43.1% | 39.2% | 37.7% | 37.0% | 36.7% |
| Other non-emitting table c1 note ** | 20.1% | 34.3% | 41.3% | 43.7% | 45.1% | 45.9% |
| Total capacity (%) | 100% | 100% | 100% | 100% | 100% | 100% |
| Total capacity (MW) | 149,244 | 183,907 | 220,858 | 234,536 | 243,420 | 258,442 |
| Storage (MW) | 2,701 | 4,877 | 6,607 | 7,285 | 7,832 | 9,021 |
Table c1 note(s)
|
||||||
| Technology type | 2025 | 2030 | 2035 | 2040 | 2045 | 2050 |
|---|---|---|---|---|---|---|
| Emitting | 17.9% | 15.6% | 9.0% | 8.0% | 6.7% | 6.5% |
| Emitting with CCS | 0.1% | 0.9% | 3.8% | 4.2% | 4.9% | 4.8% |
| Nuclear | 8.8% | 6.2% | 5.4% | 5.0% | 5.1% | 5.1% |
| Hydro | 53.1% | 43.1% | 39.6% | 38.0% | 37.6% | 37.6% |
| Other non-emitting | 20.1% | 34.3% | 42.2% | 44.8% | 45.6% | 46.0% |
| Total capacity (%) | 100% | 100% | 100% | 100% | 100% | 100% |
| Total capacity (MW) | 149,244 | 183,725 | 219,876 | 240,008 | 247,801 | 260,301 |
| Storage (MW) | 2,701 | 5,052 | 6,887 | 7,745 | 8,658 | 9,931 |
Likewise, E3MC suggests that Canada’s electric utility sector (excluding all industrial generation units) would take on the following generation characteristics in the baseline scenario (Table 6) versus in the regulatory scenario (Table 7).
| Technology type | 2025 | 2030 | 2035 | 2040 | 2045 | 2050 |
|---|---|---|---|---|---|---|
| Emitting | 14.3% | 9.9% | 7.1% | 6.9% | 6.3% | 6.2% table c3 note * |
| Emitting with CCS | 0.1% | 0.1% | 0.1% | 0.1% | 0.1% | 0.1% |
| Nuclear | 10.9% | 9.7% | 9.7% | 9.0% | 8.7% | 8.3% |
| Hydro | 62.0% | 56.4% | 52.9% | 51.5% | 50.7% | 49.9% |
| Other non-emitting | 12.6% | 23.8% | 30.2% | 32.5% | 34.1% | 35.6% |
| Total generation (%) | 100% | 100% | 100% | 100% | 100% | 100% |
| Total generation (GWh) | 620 300 | 685 808 | 772 314 | 807 363 | 836 810 | 885 514 |
Table c3 note(s)
|
||||||
| Technology type | 2025 | 2030 | 2035 | 2040 | 2045 | 2050 |
|---|---|---|---|---|---|---|
| Emitting | 14.3% | 9.7% | 3.8% | 1.7% | 0.8% | 1.1% table c4 note * |
| Emitting with CCS | 0.1% | 0.3% | 1.1% | 0.8% | 1.2% | 1.1% |
| Nuclear | 10.9% | 9.7% | 10.1% | 9.5% | 9.2% | 9.3% |
| Hydro | 62.0% | 56.4% | 54.0% | 53.5% | 53.5% | 52.5% |
| Other non-emitting | 12.6% | 23.8% | 31.1% | 34.5% | 35.3% | 36.1% |
| Total generation (%) | 100% | 100% | 100% | 100% | 100% | 100% |
| Total generation (GWh) | 620 300 | 685 689 | 774 404 | 810 726 | 838 254 | 886 766 |
Table c4 note(s)
|
||||||
In absence of the proposed Regulations (Table 6), Canada’s electricity system would have been expected to reduce unabated emitting generation from 14.3% in 2025 to 6.2% in 2050 and would have been expected to increase non-emitting generation from 85.5% in 2025 to 93.7% in 2050. By contrast, under the proposed Regulations (Table 7), Canada’s electricity system would be expected to reduce unabated emitting generation from 14.3% in 2025 to 1.1% in 2050 and would be expected to increase non-emitting generation from 85.5% in 2025 to 97.9% in 2050.
Benefits
The proposed Regulations would reduce the amount of GHGs emitted by electricity generating units across Canada, in the form of carbon dioxide (CO2), methane (CH4) and nitrous oxide (N2O), with CO2 being the most significant. Reductions in emissions of these gases would result in avoided global damage from climate change. The proposed Regulations would also reduce the amount of air pollutants emitted by electricity generating units, including nitrogen oxides (NOX), sulfur oxides (SOX), primary particulate matter less than 2.5 microns in width (PM2.5) and mercury (Hg). Reductions of these air pollutants may result in improvements to localized air quality, depending on the geographical and meteorological features of the emission sites, which may in turn result in health benefits and environmental benefits.
As emitting sources of electricity generation are replaced by low or non-emitting sources, the proposed Regulations would also result in cost savings over time to the electricity sector in the form of avoided fuel usage, variable operations and maintenance and refurbishment.
Each of these benefits is described in detail in the subsections below.
Avoided global damage from climate change
Using outputs from E3MC, the CBA estimates that the proposed Regulations would result in the reduction of 272 Mt of GHGs (expressed as CO2e) from electricity generation sold to a NERC-regulated electricity system, as well as the reduction of 70 Mt of GHGs from electricity generation used behind the fence, for total reductions of nearly 342 Mt over the 27-year (2024 to 2050) analytical period (Table 8).
| Description | 2024–2030 | 2031–2035 | 2036–2040 | 2041–2045 | 2046–2050 | 27-year total | Annual average (n=27) |
|---|---|---|---|---|---|---|---|
| CO2 (electricity system) | −1 112 | 13 024 | 75 308 | 87 058 | 93 811 | 268 088 | 9 929 |
| CH4 (electricity system) | −5 | 124 | 643 | 577 | 568 | 1 907 | 71 |
| N2O (electricity system) | −12 | 83 | 539 | 566 | 589 | 1 765 | 65 |
| CO2 ("behind-the-fence") | 2 293 | 5 508 | 20 492 | 20 689 | 20 544 | 69 527 | 2 575 |
| CH4 ("behind-the-fence") | 1 | 31 | 126 | 54 | 26 | 238 | 9 |
| N2O ("behind-the-fence") | 12 | 28 | 106 | 104 | 101 | 350 | 13 |
| Main benefits: GHG reductions attributable to electricity generation sold to the electricity system table c5 note ** | −1 129 | 13 231 | 76 490 | 88 201 | 94 968 | 271 761 | 10 065 |
| Co-benefits: GHG reductions attributable to electricity generation used "behind-the-fence" table c5 note *** | 2 306 | 5 567 | 20 725 | 20 847 | 20 671 | 70 116 | 2 597 |
| Total GHG reductions | 1 177 | 18 798 | 97 215 | 109 048 | 115 640 | 341 877 | 12 662 |
Table c5 note(s)
|
|||||||
The avoided global damage from climate change associated with these GHG reductions can be monetized using social cost estimates for each pollutant. In November 2022, the United States Environmental Protection Agency (US EPA) released its draft Report on the Social Cost of Greenhouse Gases: Estimates Incorporating Recent Scientific Advances (the draft US EPA Report), in which social cost (SC) methodologies and values have been updated and presented for CO2, CH4 and N2O. In April 2023, the Department published draft SC guidance for Canada in alignment with the SC-GHG values proposed by the US EPA. A subset of Canadian SC-GHG values from that guidance document is presented in Table 9.
| Index year | SC-CO2 | SC-CH4 | SC-N2O |
|---|---|---|---|
| 2020 | $247 | $2,107 | $69,230 |
| 2025 | $271 | $2,589 | $77,066 |
| 2030 | $294 | $3,073 | $84,903 |
| 2035 | $317 | $3,634 | $92,894 |
| 2040 | $341 | $4,194 | $100,886 |
| 2045 | $367 | $4,803 | $109,902 |
| 2050 | $394 | $5,410 | $118,919 |
Table c6 note(s)
|
|||
The Canadian SC-GHG values in Table 9 are a reflection of the most recent state of climate science. As explained in the draft US EPA Report, the updated SC-GHG values were derived from the interaction of four modules: socioeconomics and emissions, climate, damages and discounting. The socioeconomic and emissions module relies on a new set of probabilistic projections for population, income and GHG emissions developed under the Resources for the Future Social Cost of Carbon Initiative. The climate module relies on the Finite Amplitude Impulse Response model (a widely used Earth system model recommended by the National Academies), which captures the relationships between GHG emissions, atmospheric GHG concentrations and global mean surface temperature. The socioeconomic projections and outputs of the climate module are used as inputs to the damage module to estimate monetized future damages from temperature changes. The discounting module discounts the stream of future climate damages back to the year of emissions using a set of dynamic discount rates that encompass a great deal of uncertainty. As noted in the draft US EPA Report, the modules use conservative methodological assumptions and are therefore likely to underestimate the marginal damages from GHG pollution.
The CBA converted the Canadian SC-GHG values presented in Table 9 to 2022 constant dollars using a conversion factor of 1.068 98 (derived from the Consumer Price Index estimates in E3MC), then multiplied those values by the tonnage reductions in each pollutant (not in CO2e terms) summarized in Table 8, before discounting the results back to base year 2023 at 2%. As seen in Table 10, the proposed Regulations would result in $87.5 billion of avoided global damage from climate change over the 27-year analytical period, of which $69.5 billion would be attributable to electricity generation sold to the electricity system.
| Description | 2024–2030 | 2031–2035 | 2036–2040 | 2041–2045 | 2046–2050 | 27-year total | Annualized average (n=27) |
|---|---|---|---|---|---|---|---|
| CO2 (electricity system) | −306 | 3,477 | 19,809 | 22,347 | 23,440 | 68,767 | 3,321 |
| CH4 (electricity system) | −1 | 15 | 81 | 76 | 76 | 248 | 12 |
| N2O (electricity system) | −3 | 22 | 140 | 145 | 148 | 453 | 22 |
| CO2 ("behind-the-fence") | 632 | 1,478 | 5,392 | 5,313 | 5,134 | 17,949 | 867 |
| CH4 ("behind-the-fence") | 0.1 | 4 | 16 | 7 | 4 | 30 | 1 |
| N2O ("behind-the-fence") | 3 | 7 | 28 | 27 | 26 | 90 | 4 |
| Main benefits: Climate change benefits attributable to electricity generation sold to the electricity system table c7 note * | −310 | 3,514 | 20,030 | 22,568 | 23,665 | 69,468 | 3,355 |
| Co-benefits: Climate change benefits attributable to electricity generation used "behind-the-fence" table c7 note ** | 635 | 1,489 | 5,436 | 5,346 | 5,163 | 18,069 | 873 |
| Total climate change benefits | 325 | 5,003 | 25,466 | 27,914 | 28,828 | 87,537 | 4,227 |
Table c7 note(s)
|
|||||||
As noted in the description section of the RIAS, a compliance flexibility would be available until 2040 for any unit that commissions a CCS system, which would allow those units to operate up to 40 t/GWh for up to seven years or until December 31, 2039, whichever comes first, as long as the unit has demonstrated that it can operate at or below 30 t/GWh for two specified periods of time during a year. The CBA modelling assumes that such units would be capable of meeting 30 t/GWh by 2035 and therefore does not model use of this compliance flexibility. It should be noted that, depending on the uptake of the compliance flexibility among CCS equipped units, GHG reductions and associated monetized benefit, fuel cost savings and variable O&M costs for these units may be slightly overestimated in the years prior to 2040. However, since the emissions intensity standard for natural gas units (the majority of CCS users) in the baseline scenario is 420 to 550 t/GWh as per the Regulations Limiting Carbon Dioxide Emissions from Natural Gas-fired Generation of Electricity, dropping from those baseline standards to 40 t/GWh in the policy scenario (rather than 30 t/GWh) for a limited number of years is not expected to significantly reduce the incremental climate change benefits depicted in Table 10.
Potential health benefits
Using outputs from E3MC, the CBA estimates that the proposed Regulations would result in air pollutant emission reductions from electricity generation sold to the electricity system as well as from electricity generation used “behind-the-fence.” Table 11 provides a breakdown of these reductions by pollutant over the 27-year analytical period.
| Description | 2024–2030 | 2031–2035 | 2036–2040 | 2041–2045 | 2046–2050 | 27-year total | Annual average (n=27) |
|---|---|---|---|---|---|---|---|
| NOX (electricity system) | 2 154 | 25 140 | 131 363 | 95 244 | 90 705 | 344 605 | 12 763 |
| SOX (electricity system) | 9 277 | 6 942 | 42 663 | 18 965 | 18 835 | 96 682 | 3 581 |
| PM2.5 (electricity system) | 44 | 1 695 | 8 557 | 7 858 | 7 983 | 26 138 | 968 |
| Hg (electricity system) | 0.010 8 | 0.062 5 | 0.313 7 | 0.314 0 | 0.313 8 | 1.014 9 | 0.037 6 |
| NOX ("behind-the-fence") | 1 750 | 3 891 | 17 863 | 28 040 | 27 952 | 79 496 | 2 944 |
| SOX ("behind-the-fence") | 2 033 | 2 315 | 8 186 | 23 445 | 23 220 | 59 200 | 2 193 |
| PM2.5 ("behind-the-fence") | 14 | 17 | 158 | 544 | 534 | 1 268 | 47 |
| Hg ("behind-the-fence") | 0.000 3 | 0.001 1 | 0.004 2 | 0.004 3 | 0.004 3 | 0.014 2 | 0.000 5 |
The distribution of these incremental air pollutant emission reductions by province over the analytical period is presented in Table 12.
| Province | NOX | SOX | PM2.5 | Hg |
|---|---|---|---|---|
| N.L. | 591 | 63 | 7 | 0.000 0 |
| P.E.I. | 146 | 185 | 9.5 | 0.000 0 |
| N.S. | 27 816 | 15 039 | −224 | 0.015 4 |
| N.B. | 4 112 | 29 004 | 65 | 0.000 0 |
| Que. | 0.0 | 0.0 | 0.0 | 0.000 0 |
| Ont. | 225 718 | −55 | 24 412 | 0.000 1 |
| Man. | 0.0 | 0.0 | 0.0 | 0.000 0 |
| Sask. | 50 821 | 68 513 | 1 900 | 0.836 3 |
| Alta. | 103 914 | 41 712 | 1 064 | 0.015 0 |
| B.C. | 10 978 | 1 421 | 172 | 0.162 1 |
| Y.T. | 0.6 | 0 | 0 | 0.000 0 |
| N.W.T. | 3.7 | 0 | 0.1 | 0.000 0 |
| Nvt. | 2 | 0 | 0 | 0.000 0 |
| Total | 424 101 | 155 882 | 27 406 | 1.029 0 |
Table c9 note(s)
|
||||
As seen in Table 12, Alberta, Saskatchewan, Ontario, Nova Scotia and New Brunswick are the provinces that would incur the greatest amount of air pollutant emission reductions, largely attributable to the switch from unabated natural gas plants to low, or non-emitting sources of electricity generation. Depending on the location of these air pollutant emission reductions, the proposed Regulations would be expected to result in improvements to localized air quality. It should be noted that biomass, biomass CCS and NG CCS are associated with air pollutants emissions from electricity generation. As such, provinces with significant incremental buildout of these technologies may experience less overall incremental air pollutant reductions than provinces who rely more on non-emitting technology types.
Air pollution is recognized globally as a major contributor to the development of disease and premature death and is a key environmental risk factor to human health in Canada. Exposure to air pollution increases the risk of premature mortality from heart disease, stroke and lung cancer, as well as the risk of adverse respiratory and cardiovascular diseases. Children, the elderly and individuals with underlying health conditions are particularly vulnerable to the adverse effects of air pollution. Moreover, scientific evidence shows that adverse health effects occur at very low concentrations for many pollutants, with no indication of a threshold below which there are no risks. Therefore, a small decrease in air pollution is associated with a reduction in the risk of adverse health outcomes for exposed populations. The Department of Health estimates that in 2015, air pollution from electricity generating units contributes to about 150 premature deaths per year in Canada as well as many non-fatal outcomes, with a total cost of $1.2 billion per year (2015 constant dollars).footnote 28 While negative health impacts are expected to be significantly mitigated by the Regulations Amending the Reduction of Carbon Dioxide Emissions from Coal-fired Generation of Electricity Regulations, the proposed Regulations would be expected to also reduce adverse health impacts.
The proposed Regulations would also result in 1 029 kg of mercury emissions reductions, the majority of which would be located in southern Saskatchewan. Exposure to mercury is associated with a wide range of adverse health effects in humans (notably, the nervous system is sensitive to the toxicity of mercury), with developing fetuses and children being the most susceptible to these adverse health effects.
Impacts to air quality and associated health benefits have not been quantified nor monetized in this analysis. However, air pollutant emission reductions associated with the proposed Regulations would be expected to reduce the risk of adverse health outcomes for affected populations, which would accrue as monetized benefits into the future.
Potential environmental benefits
To the extent that the reductions in air pollution depicted in Table 12 improve localized air quality, the proposed Regulations may also reduce environmental harms in the form of improved visibility, avoided cleaning costs for surface soiling, improved yield for crop producers, improved health of forest ecosystems and reduced risk of illness or premature death within sensitive wildlife or livestock populations, depending on what is located in proximity to the emission site. Impacts to air quality and associated environmental benefits have similarly not been quantified nor monetized in this analysis.
Fuel cost savings
Emitting plant types require a fuel source to generate electricity (e.g. natural gas, heavy fuel oil, light fuel oil, liquefied petroleum gas, biomass, or waste). By contrast, non-emitting plant types use renewable energy sources such as water, wind, heat or the sun to generate electricity, all of which are provided by the natural environment. With the exception of plants that implement CCS,footnote 29 the switch from emitting plant types to low or non-emitting plant types under the proposed Regulations would significantly reduce operational costs to the electricity generation sector with respect to fuel. Using outputs from E3MC, the CBA estimates that the proposed Regulations would result in a total of $13.5 billion in fuel savings for electricity generating units over the 27-year analytical period. The distribution of these savings by province is presented in Table 13.
| Province | 2024-2030 | 2031-2035 | 2036-2040 | 2041-2045 | 2046-2050 | 27-year total | Annualized average (n=27) |
|---|---|---|---|---|---|---|---|
| NL | 0 | 54 | 237 | 103 | 48 | 442 | 21 |
| PE | 0 | 4 | 8 | 1 | 0 | 13 | 1 |
| NS | -5 | 147 | 651 | 661 | 532 | 1,986 | 96 |
| NB | 4 | 81 | 279 | 64 | 130 | 558 | 27 |
| QC | 0 | 6 | 28 | 26 | 24 | 84 | 4 |
| ON | -23 | 245 | 1,484 | 1,798 | 1,353 | 4,858 | 235 |
| MB | 0 | 0 | 0 | 0 | 0 | 0 | 0 |
| SK | -2 | 100 | 632 | 718 | 701 | 2,148 | 104 |
| AB | 2 | 135 | 899 | 1,035 | 1,141 | 3,211 | 155 |
| BC | 0 | 13 | 74 | 69 | 66 | 222 | 11 |
| YK | 0 | 0 | 0 | 0 | 0 | 0 | 0 |
| NT | 0 | 0 | 0 | 0 | 0 | 0 | 0 |
| NU | 0 | 0 | 0 | 0 | 0 | 0 | 0 |
| Total | -25 | 785 | 4,292 | 4,475 | 3,994 | 13,522 | 653 |
Table c10 note(s)
|
|||||||
A detailed example of how fuel cost savings were calculated will be made available upon request by the Department in the coming months.
Variable operations and maintenance cost-savings
When considering all types of low or non-emitting plants, the average cost to operate and maintain those units on a variable basis (per MWh generation) is lower than that of unabated emitting plant types. As such, the switch from emitting plant types to low or non-emitting plant types under the proposed Regulations would tend to reduce variable operations and maintenance (O&M) costs to the electricity sector. Using outputs from E3MC, the CBA estimates that the proposed Regulations would result in a total of $1.4 billion in O&M cost savings over the 27-year analytical period. The distribution of this cost savings by province is presented in Table 14.
| Province | 2024-2030 | 2031-2035 | 2036-2040 | 2041-2045 | 2046-2050 | 27-year total | Annualized average (n=27) |
|---|---|---|---|---|---|---|---|
| NL | 0 | 2 | 9 | 3 | 2 | 16 | 1 |
| PE | 0 | 0 | 1 | 1 | 1 | 3 | 0 |
| NS | 0 | 8 | 26 | 30 | 29 | 93 | 4 |
| NB | 1 | 10 | 26 | 10 | 19 | 67 | 3 |
| QC | 0 | 0 | -1 | -1 | 0 | -2 | 0 |
| ON | -3 | 32 | 147 | 166 | 140 | 482 | 23 |
| MB | 0 | 0 | 0 | 0 | 0 | 0 | 0 |
| SK | 0 | 17 | 85 | 63 | 40 | 205 | 10 |
| AB | -5 | 23 | 264 | 185 | 182 | 650 | 31 |
| BC | -1 | -8 | -25 | -32 | -45 | -111 | -5 |
| YK | 0 | 0 | 0 | 0 | 0 | 0 | 0 |
| NT | 0 | 0 | 0 | 0 | 0 | 0 | 0 |
| NU | 0 | 0 | 0 | 0 | 0 | 0 | 0 |
| Total | -7 | 83 | 531 | 426 | 368 | 1,402 | 68 |
A detailed example of how O&M savings were calculated will be made available upon request by the Department in the coming months.
Refurbishment cost-savings
Refurbishment costs are periodic capital costs undertaken at the end of a unit’s operational lifetime, spent to return a unit to a condition similar to that at the time of its original commissioning. E3MC does not apply the concept of operating lifetime to units and thus, many units in the model are assumed to continue to operate regardless of their age. To ensure that periodic refurbishment costs are reflected in the analysis, the CBA places an extra cost on units in the year that they would reach the end of their operating lifetime. Once that extra cost is applied, the CBA models that unit operating for another operating lifetime, after which the extra cost would be incurred again. This cycle is repeated from a unit’s online date to the end of the analytical period in 2050.
The CBA conceptualizes refurbishment cost as the “brownfield” cost of replacing an old unit with a new unit of equivalent type and capacity. Brownfield means that a new unit is constructed using an old unit’s infrastructure as a basis, which is much less costly than constructing a new unit in a new area (“greenfield”). The most significant cost difference between brownfield and greenfield construction is the presence of fuel feedstock lines and electricity transmission lines that connect the unit upstream and downstream. The CBA makes a conservative assumption that the cost of brownfield construction is one third that of greenfield construction for any given plant type. This conservative assumption likely understates the magnitude of cost savings that would be realized.
Under the proposed Regulations, provinces with relatively high-emitting capacity in the baseline scenario are expected to see foregone refurbishment costs in the regulatory scenario as units retire, with two exceptions. The first exception is unabated natural gas plants that retrofit with CCS, which are assumed to remain on their original refurbishment schedules but would now incur higher brownfield costs at the end of their operating lifetimes. The second exception is electricity storage, which has a shorter operating lifetime than other electricity system technologies. Overall, the CBA modelling estimates that the proposed Regulations would result in a total of $55 million of incremental refurbishment cost savings over the 27-year analytical period. The distribution of refurbishment cost savings by province is presented in Table 15.
| Province | 2024-2030 | 2031-2035 | 2036-2040 | 2041-2045 | 2046-2050 | 27-year total | Annualized average (n=27) |
|---|---|---|---|---|---|---|---|
| NL | 0 | 0 | 11 | 29 | 0 | 41 | 2 |
| PE | 0 | 0 | 0 | 0 | 0 | 0 | 0 |
| NS | 0 | 0 | -24 | 0 | 0 | -24 | -1 |
| NB | 0 | 0 | 0 | 0 | 0 | 0 | 0 |
| QC | 0 | 30 | -6 | 3 | 0 | 27 | 1 |
| ON | 0 | 48 | 101 | 0 | 0 | 149 | 7 |
| MB | 0 | 0 | 0 | 0 | 0 | 0 | 0 |
| SK | 0 | 0 | -5 | -85 | 0 | -90 | -4 |
| AB | 99 | 0 | 0 | -219 | -78 | -198 | -10 |
| BC | 0 | 0 | 111 | -9 | 49 | 151 | 7 |
| YK | 0 | 0 | 0 | 0 | 0 | 0 | 0 |
| NT | 0 | 0 | 0 | 0 | 0 | 0 | 0 |
| NU | 0 | 0 | 0 | 0 | 0 | 0 | 0 |
| Total | 99 | 77 | 189 | -281 | -28 | 55 | 3 |
Costs
As emitting sources of electricity generation are replaced by low or non-emitting sources, the proposed Regulations would result in incremental costs related to constructing new generation and storage capacity, constructing new transmission lines, fixed operations and maintenance, residual value of capital on early retirements and increased net import expenditure, alongside increased administrative and government costs.
Each of these costs are described in detail in the subsections below.
Capital costs for new electricity system capacity
New electricity system capacity denotes the year-over-year increase in generation and storage capacity required in both the baseline scenario and the regulatory scenario to meet energy demand and other constraints. The proposed Regulations would result in less new capital buildout of emitting plant types and more new capital buildout of low- or non-emitting plant types. Most non-emitting plant types have a higher capital cost per MW capacity than their emitting counterparts. Emitting plant types with CCS also have a higher capital cost per MW capacity than their unabated counterparts. Accordingly, the cost-savings associated with forgone buildout of new emitting capacity are generally smaller than the costs associated with buildout of new low- or non-emitting capacity.
Using outputs from E3MC, the CBA estimates that the proposed Regulations would result in a total of $53.7 billion in incremental capital costs to the electricity generation sector for new electricity system capacity over the 27-year analytical period. Total capital cost distributed by province is presented in Table 16 and annualized average capital cost by technology type and province is presented in Table 17.
| Province | 2024-2030 | 2031-2035 | 2036-2040 | 2041-2045 | 2046-2050 | 27-year total | Annualized average (n=27) |
|---|---|---|---|---|---|---|---|
| NL | 0 | 0 | 780 | 210 | 1,235 | 2,225 | 107 |
| PE | 0 | 0 | 0 | 0 | 0 | 0 | 0 |
| NS | 1,648 | 3,730 | 642 | 743 | -623 | 6,140 | 297 |
| NB | 0 | 0 | 1,405 | 4,340 | 0 | 5,745 | 277 |
| QC | 2 | 294 | 64 | 0 | -79 | 281 | 14 |
| ON | -63 | 3,900 | 10,251 | -1,225 | 217 | 13,081 | 632 |
| MB | 0 | 0 | 0 | 0 | 0 | 0 | 0 |
| SK | 340 | 1,241 | 2,467 | 30 | 2,628 | 6,707 | 324 |
| AB | 2,607 | 14,606 | 683 | 357 | -1,340 | 16,914 | 817 |
| BC | 0 | 1,626 | 953 | 88 | -93 | 2,574 | 124 |
| YK | 0 | 0 | 0 | 0 | 0 | 0 | 0 |
| NT | 0 | 0 | 0 | 0 | 0 | 0 | 0 |
| NU | 0 | 0 | 0 | 0 | 0 | 0 | 0 |
| Total | 4,534 | 25,398 | 17,246 | 4,543 | 1,946 | 53,667 | 2,592 |
| NL | NS | NB | QC | ON | SK | AB | BC | Total | |
|---|---|---|---|---|---|---|---|---|---|
| OGCT | 0 | 43 | -13 | 0 | -2 | -19 | -43 | 0 | -34 |
| OGCC | 0 | 0 | -25 | 0 | -4 | -36 | -82 | 0 | -147 |
| Small OGCC | 0 | -14 | -28 | 0 | -4 | -40 | -90 | 0 | -177 |
| NG CCS table d2 note * | 0 | 0 | 0 | 0 | 0 | 181 | 820 | 0 | 1,001 |
| Nuclear | 0 | 0 | 281 | 0 | 0 | 204 | 196 | 0 | 681 |
| Base hydro | 26 | 27 | 38 | 0 | 0 | 4 | 55 | 1 | 151 |
| Peak hydro | 0 | 0 | 0 | 14 | 452 | 0 | 0 | 94 | 560 |
| Small hydro | 21 | 0 | 0 | -3 | 95 | 7 | -84 | 10 | 45 |
| Biomass | 12 | 138 | 25 | 0 | 10 | 3 | 48 | 2 | 238 |
| Biomass CCS | 0 | 0 | 0 | 0 | 105 | 9 | 12 | 11 | 138 |
| Onshore wind | 18 | 73 | -0.1 | 2 | -25 | 4 | -24 | 5 | 52 |
| Offshore wind | 27 | 19 | -0.04 | 0 | 0 | 0 | 0 | 0 | 46 |
| Solar PV | -0.1 | 2 | 0 | -0.01 | 4 | 8 | 5 | 0.1 | 19 |
| Storage | 4 | 8 | 0 | 1 | 2 | -1 | 4 | 2 | 19 |
| Total | 107 | 297 | 277 | 14 | 632 | 324 | 817 | 124 | 2,592 |
Table d2 note(s)
|
|||||||||
As depicted in Table 16, Prince Edward Island, Manitoba, Yukon, Northwest Territories and Nunavut are not expected to undertake any significant build-out of electricity system technologies in response to the proposed Regulations, while significant new investment is expected in Alberta, Ontario, Saskatchewan, Nova Scotia and New Brunswick. As depicted in Table 17, the majority of capital cost for those provinces would be attributable to the build-out of biomass in Nova Scotia, nuclear in New Brunswick, peak hydro in Ontario, nuclear in Saskatchewan and NG CCS in Alberta. Overall, the proposed Regulations would result in decreased new capital build-out of unabated emitting generation technologies (OGCT, OGCC and small OGCC), paired with increased new build-out of all other types of electricity system technologies.
A detailed example of how capital costs for new electricity system capacity was calculated will be made available upon request by the Department in the coming months. The cost to government for incremental uptake of the modelled ITC associated with the capital costs to the electricity generation sector denoted in Table 16 is presented in the government cost subsection.
Capital cost for new transmission lines
NextGrid modelling indicates that minimizing the system-wide costs of the proposed Regulations while ensuring reliability would entail provinces constructing certain interties to facilitate the movement of domestically produced electricity. Using outputs from NextGrid, the CBA estimates that the proposed Regulations would result in a total of $6.7 billion in incremental capital costs for new interprovincial transmission lines over the 27-year analytical period. The CBA assumes that the capital cost of all new transmission lines would be shared evenly between the two provinces that the line connects. The distribution of these infrastructure costs by province is presented in Table 18.
| Province | 2024-2030 | 2031-2035 | 2036-2040 | 2041-2045 | 2046-2050 | 27-year total | Annualized average (n=27) |
|---|---|---|---|---|---|---|---|
| NL | 0 | 0 | 0 | 0 | 0 | 0 | 0 |
| PE | 0 | 79 | 0 | 0 | 0 | 79 | 4 |
| NS | 0 | 0 | 0 | 0 | 0 | 0 | 0 |
| NB | 0 | 79 | 0 | 0 | 0 | 79 | 4 |
| QC | 0 | 0 | 558 | 0 | 0 | 558 | 27 |
| ON | 0 | 443 | 597 | 52 | 291 | 1,383 | 67 |
| MB | 0 | 443 | 38 | 70 | 486 | 1,038 | 50 |
| SK | 0 | 437 | 0 | 18 | 196 | 651 | 31 |
| AB | 0 | 1,132 | 0 | 374 | 146 | 1,653 | 80 |
| BC | 0 | 694 | 0 | 374 | 146 | 1,215 | 59 |
| YK | 0 | 0 | 0 | 0 | 0 | 0 | 0 |
| NT | 0 | 0 | 0 | 0 | 0 | 0 | 0 |
| NU | 0 | 0 | 0 | 0 | 0 | 0 | 0 |
| Total | 0 | 3,309 | 1,193 | 889 | 1,265 | 6,656 | 321 |
Since the development and implementation of a new interprovincial transmission line requires many years to become operational, all interties that would come online between 2024 and 2030 are already planned and therefore, are not considered incremental to the proposed Regulations. The costs in Table 18 were calculated by multiplying the modelled transmission capacity (MW) by the estimated marginal transmission capital cost ($/MW), as denoted in Table 19. Variance in marginal transmission capital cost is attributable to different line distances (kilometres) as well as provincial differences in geography and permitting.
| Connected provinces | Modeled transmission capacity (MW) | Average marginal transmission capital cost ($/MW, millions of dollars, 2022 constant dollars, undiscounted) |
|---|---|---|
| NB – PE | 125 | 1.6 |
| ON – QC | 2 000 | 0.8 |
| MB – ON | 666 | 3.6 |
| MB – SK | 110 | 3.3 |
| SK – MB | 108 | 3.3 |
| AB – SK | 300 | 3.7 |
| BC – AB | 2 100 | 1.6 |
The proposed Regulations are not expected to create an incentive to expand interties to the Territories, as most generating units in the Territories are less than 25 MW in capacity and not connected to a NERC-regulated electricity system and therefore fall outside the scope of the proposed Regulations. Of note, the CBA does not account for any potential new build-out of intra-provincial transmission lines that may be required to connect new infrastructure build-out to the electricity system, as it is assumed that new infrastructure would make use of existing intra-provincial transmission lines.
Fixed operations and maintenance cost
When considering all types of low- or non-emitting plants, the average cost to operate and maintain on a fixed basis (per MW capacity) is higher than that of unabated emitting plant types. As such, the switch from emitting plant types to low- or non-emitting plant types under the proposed Regulations would tend to increase fixed O&M costs to the electricity sector. E3MC suggests that the proposed Regulations would result in a total of $6.4 billion in fixed O&M costs over the 27-year analytical period. The distribution of these costs by province is presented in Table 20.
| Province | 2024-2030 | 2031-2035 | 2036-2040 | 2041-2045 | 2046-2050 | 27-year total | Annualized average (n=27) |
|---|---|---|---|---|---|---|---|
| NL | 0 | -4 | 28 | 68 | 165 | 257 | 12 |
| PE | 0 | 0 | -2 | -2 | -2 | -6 | 0 |
| NS | 30 | 60 | 146 | 219 | 178 | 633 | 31 |
| NB | 0 | 0 | 26 | 511 | 463 | 1,001 | 48 |
| QC | 0 | 3 | 19 | 12 | 6 | 40 | 2 |
| ON | -3 | -38 | 200 | 159 | 31 | 350 | 17 |
| MB | 0 | 0 | 0 | 0 | 0 | 0 | 0 |
| SK | 5 | 62 | 182 | 253 | 301 | 802 | 39 |
| AB | 57 | 490 | 1,045 | 966 | 799 | 3,357 | 162 |
| BC | 0 | -16 | -24 | -7 | -10 | -57 | -3 |
| YK | 0 | 0 | 0 | 0 | 0 | 0 | 0 |
| NT | 0 | 0 | -2 | -2 | -2 | -6 | 0 |
| NU | 0 | 0 | 0 | 0 | 0 | 0 | 0 |
| Total | 89 | 556 | 1,619 | 2,179 | 1,930 | 6,372 | 308 |
A detailed example of how fixed O&M costs were calculated will be made available upon request by the Department in the coming months.
Residual value of capital on early retirements
As previously noted, the proposed Regulations do not prescribe any particular compliance pathway onto any particular unit that would not meet the CO2 emissions intensity limit starting in 2035 and all results presented in the CBA represent a modelled scenario indicating what may occur in response to the proposed Regulations under a central case. Within this central case, NextGrid modelled the decisions that may be made by existing units that do not meet the CO2 emissions intensity limit starting in 2035 (i.e. retire early, retrofit with CCS, or change operation regime to operate under the mass-based emission/duration flexibility), while E3MC modelled the decisions that may be made by all other units.
Under the central case modelling, the majority of unabated emitting units (56%) would continue to operate in a limited manner under the mass-based emission/duration flexibility in the year that the CO2 emissions intensity limit begins applying to those units to provide backup capacity to the electricity system for reliability purposes. Another proportion of unabated emitting units (35%) would continue to operate by implementing a CCS system to meet the CO2 emissions intensity limit. A minority of affected emitting units (9%) would retire earlier than they otherwise would have in the absence of the proposed Regulations.
Using outputs from E3MC to monetize the retirement compliance pathway set out by NextGrid, the CBA estimates that the residual value of capital on early retirements would total $1.3 billion over the 27-year analytical period (or a 27-year annualized average of $65 million), all of which would be expected to occur in 2035. These costs were estimated by first multiplying the capacity (kW) of each retired unit in 2034 (i.e. their last year of full production) by the marginal generation capacity capital cost ($/kW) of those units in 2035. This represents the greenfield cost to construct a new unit of equivalent capacity in the year of retirement. To transform this total value into the residual value of retired capital, those greenfield costs were then multiplied by the fraction of operating lifetime remaining for each unit, based on their online date as a proxy for their commissioning date.
Insofar that other capital would need to be constructed (or imports would need to rise) to replace the generation provided by the units that would retire early, assigning a cost to early retirements may constitute double-counting from a CBA perspective. However, this cost is retained within the CBA to recognize industry costs that may arise from unpaid debt servicing on assets that cease to operate.
Increased international net import expenditure
Using outputs from E3MC, the CBA estimates that incremental international export revenue would decrease by $5.6 billion (2% decrease from the baseline scenario), while incremental import expenditure would increase by $6 million (0.01% increase from the baseline scenario). Accordingly, net import expenditure (import expenditure minus export revenue) from international trade would increase by $5.6 billion over the 27-year analytical period. The distribution of incremental net import expenditure by province is presented in Table 21.
| Province | 2024-2030 | 2031-2035 | 2036-2040 | 2041-2045 | 2046-2050 | 27-year total | Annualized average (n=27) |
|---|---|---|---|---|---|---|---|
| NL | 0 | 0 | 0 | 0 | 0 | 0 | 0 |
| PE | 0 | 0 | 0 | 0 | 0 | 0 | 0 |
| NS | 0 | 0 | 0 | 0 | 0 | 0 | 0 |
| NB | -12 | -41 | -85 | -118 | -54 | -309 | -15 |
| QC | 69 | 449 | -1,274 | 998 | 1,758 | 2,000 | 97 |
| ON | -41 | 534 | -972 | -686 | -202 | -1,365 | -66 |
| MB | 12 | 390 | 1,296 | 1,488 | 752 | 3,938 | 190 |
| SK | 0 | 5 | 5 | -58 | -54 | -103 | -5 |
| AB | 0 | 3 | 21 | 26 | 20 | 70 | 3 |
| BC | 13 | 17 | -110 | 303 | 1,127 | 1,350 | 65 |
| YK | 0 | 0 | 0 | 0 | 0 | 0 | 0 |
| NT | 0 | 0 | 0 | 0 | 0 | 0 | 0 |
| NU | 0 | 0 | 0 | 0 | 0 | 0 | 0 |
| Total | 41 | 1,357 | -1,118 | 1,953 | 3,348 | 5,581 | 270 |
A detailed example of how fuel net export revenue was calculated will be made available upon request by the Department in the coming months. The CBA assumes that there would be no significant difference in the average emissions intensity of electricity generated in Canada versus that generated in the US for the purpose of bilateral trade. Carbon leakage is not expected to constitute a risk to the achievement of the avoided climate change damages presented in the benefits subsection.
The CBA considers that any impacts the proposed Regulations may have on domestic net import expenditure are transfers and are therefore analyzed in the distributional analysis section. It should be noted that, subject to some constraints, trade is an alternative to capital build out and would be selected when the latter is relatively more expensive. As such, provinces that are expected to increase their international or domestic net imports would also experience forgone increased capital costs for new electricity generation capacity. In other words, should the estimated trade impacts not occur as modelled, then the incremental capital cost for new electricity system capacity depicted in Table 16 would increase proportionately for import-dependent provinces.
Administrative costs
As noted in the description section, administrative requirements under the proposed Regulations would apply to any fossil-fuel fired electricity generation unit with capacity greater than or equal to 25 MW that is connected to a NERC-regulated electricity system, while compliance requirements (i.e. meeting the 30 t/GWh emissions intensity limit or appropriate exception) would apply to any fossil-fuel fired electricity generation unit with capacity greater than or equal to 25 MW that has net exports to a NERC-regulated electricity system. In alignment with NextGrid modelling, the CBA estimates that 125 facilities would be subject to administrative requirements,footnote 30 of which 124 would be expected to submit full-length annual reports. While certain facilities may be comprised of multiple electricity-generating units, the CBA assumes that the same “per event” administrative costs would be incurred for each facility, regardless of the number of units contained in each. Assumptions used to assess administrative costs are presented in Table 22.
| Administrative activity | Timing | Facility count (in 2024) | Occupational category | Hours spent | Hourly wage rate (including overhead) | Approximate cost per event |
|---|---|---|---|---|---|---|
| Familiarization with administrative requirements | 2024 | 125 | Natural and applied sciences occupations | 12.0 | $53.38 | $641 |
| Familiarization with administrative requirements | 2024 | 125 | Professional occupations in law and social, community and government services | 8.0 | $53.43 | $427 |
| Familiarization with administrative requirements | 2024 | 125 | Senior management occupations | 4.0 | $76.77 | $307 |
| Registration report – unit information and process flow diagram | 2024 | 125 | Natural and applied sciences and related occupations | 4.0 | $53.38 | $214 |
| Registration number assignment | 2024 | 125 | Office support occupations | 0.5 | $31.19 | $16 |
| Annual report – data retrieval and entry, sampling and analysis, calculations (CO2 emissions, electricity generation, system net-exports), send report | 2035 onward | 124 | Natural and applied sciences and related occupations | 20.0 | $53.38 | $1,068 |
| Annual short report – calculate system net-exports, send report | 2035 onward | 1 | Natural and applied sciences and related occupations | 3.0 | $53.38 | $160 |
| Annual report – calculation of net thermal energy produced | 2035 onward | 75 | Natural and applied sciences and related occupations | 4.0 | $53.38 | $214 |
| Annual report – CCS captured emissions | 2035 onward | 19 | Natural and applied sciences and related occupations | 4.0 | $53.38 | $214 |
| Annual report – CO2 emissions associated with hydrogen or purchased steam | 2035 onward | 19 | Natural and applied sciences and related occupations | 1.0 | $53.38 | $53 |
| Annual report – approval | 2035 onward | 124 | Senior management occupations | 2.0 | $76.77 | $154 |
| Annual short report – approval | 2035 onward | 1 | Senior management occupations | 0.5 | $76.77 | $38 |
| Annual report associated record making | 2035 onward | 125 | Office support occupations | 1.0 | $31.19 | $31 |
Under the policy scenario, NextGrid modelling estimates that the total capacity across all fossil-fuel fired electricity generation units would decrease by a total of 8.53% between 2024 and 2050, for an average decrease of 0.34% per year. This average annual decrease in capacity was used as a proxy for negative growth in the number of affected facilities over the analytical period. Using the inputs in Table 22 and the negative growth rate for affected facilities, the proposed Regulations would be expected to result in $2.0 million in incremental administrative costs to industry over the 27-year analytical period.
Government costs
The proposed Regulations would be expected to result in a total of $104 million in incremental government costs over the 27-year analytical period. Of this total, the central case modelling estimates that the government would spend $55 million in incremental federal funding under the modelled ITC associated with the incremental buildout of qualifying technologies denoted in Table 16. The government would also spend $48 million on program administration, comprised mostly of new salaries for the Department set to begin in 2024 when the Regulations are proposed to be registered. Costs associated with compliance promotion (i.e. costs related to developing, posting and distributing promotional materials) are expected to be minimal as the pool of impacted parties is limited and known.
Additionally, the Department would be expected to incur $1 million in incremental costs related to training, inspections, investigations and measures to deal with any alleged violations, as well as compliance and promotion activities. A one-time cost of $58,192 would also be required for the training of enforcement officers alongside a one-time cost of $84,195 for strategic intelligence assessment work (2022 dollars, undiscounted). The CBA assumes that these costs would occur in 2034, one year prior to the year that the emissions intensity limits begin applying to affected units. Ongoing (annual) costs of $32,912 would be required for administration, coordination and analysis to support enforcement activities, as well as $94,743 for enforcement broken down as follows: $15,259 for inspections (which includes Operations and Maintenance costs, transportation and sampling costs) and measures to deal with alleged violations (including warnings, environmental protection compliance orders and injunctions), $1,073 for investigations, $2,378 for prosecutions and $43,121 for ongoing intelligence (2022 dollars, undiscounted). The CBA assumes that these costs would begin in 2035, the year that the emissions intensity limits begin applying to affected units.
Cost-benefit statement
- Number of years: 27 years (2024 to 2050)
- Base year for costing: 2022
- Present value base year: 2023
- Discount rate: 2%
| Description | 2024-2030 | 2031-2035 | 2036-2040 | 2041-2045 | 2046-2050 | 27-year total | Annualized average (n=27) |
|---|---|---|---|---|---|---|---|
| Main benefit: climate change mitigation | -310 | 3,514 | 20,030 | 22,568 | 23,665 | 69,468 | 3,355 |
| Co-benefit: climate change mitigation | 635 | 1,489 | 5,436 | 5,346 | 5,163 | 18,069 | 873 |
| Cost-savings to industry | 67 | 946 | 5,013 | 4,619 | 4,334 | 14,979 | 723 |
| Total monetized benefits | 392 | 5,949 | 30,479 | 32,534 | 33,162 | 102,516 | 4,951 |
| Main benefit: air pollution reductions (in kilotonnes) | 11 | 34 | 183 | 122 | 118 | 467 | 17 |
| Co-benefit: air pollution reductions (in kilotonnes) | 4 | 6 | 26 | 52 | 52 | 140 | 5 |
| Total quantified benefits (in kilotonnes) | 15 | 40 | 209 | 174 | 169 | 607 | 22 |
| Description | 2024-2030 | 2031-2035 | 2036-2040 | 2041-2045 | 2046-2050 | 27-year total | Annualized average (n=27) |
|---|---|---|---|---|---|---|---|
| Capital costs for new electricity system capacity | 4,534 | 25,398 | 17,246 | 4,543 | 1,946 | 53,667 | 2,592 |
| Capital costs for new transmission lines | 0 | 3,309 | 1,193 | 889 | 1,265 | 6,656 | 321 |
| Fixed O&M costs | 89 | 556 | 1,619 | 2,179 | 1,930 | 6,372 | 308 |
| Residual value of capital on early retirements | 0 | 1,263 | 0 | 0 | 0 | 1,263 | 61 |
| International net import costs | 41 | 1,357 | -1,118 | 1,953 | 3,348 | 5,581 | 270 |
| Administrative costs | 0.2 | 0.1 | 0.6 | 0.6 | 0.5 | 2 | 0.1 |
| Government costs | 66 | 26 | 5 | 4 | 4 | 104 | 8 |
| Total costs | 4,731 | 31,910 | 18,945 | 9,568 | 8,492 | 73,647 | 3,557 |
| Description | 2024-2030 | 2031-2035 | 2036-2040 | 2041-2045 | 2046-2050 | 27-year total | Annualized average (n=27) |
|---|---|---|---|---|---|---|---|
| Total monetized benefits table d10 note * | 392 | 5,949 | 30,479 | 32,534 | 33,162 | 102,516 | 4,951 |
| Total monetized costs | 4,731 | 31,910 | 18,945 | 9,568 | 8,492 | 73,647 | 3,557 |
| Total net benefits | -4,339 | -25,961 | 11,533 | 22,966 | 24,670 | 28,869 | 1,394 |
Table d10 note(s)
|
|||||||
As depicted in Table 25, the proposed Regulations are estimated to result in a total of $28.9 billion in monetized net benefits to society over the 27-year analytical period, or $1.4 billion in net benefits per year on an annualized basis.
Distributional analysis
Costs and cost savings by province
The proposed Regulations are expected to result in a significant increase to domestic trade activity, greatly facilitated by the new provincial interties modelled by NextGrid to minimize the system-wide compliance costs. With the modelled interties from NextGrid in place, outputs from E3MC were used to estimate that domestic trade would increase by $43 billion in economic value over the 27-year analytical period (17% increase from the baseline scenario). As domestic trade constitutes a transfer between domestic parties, incremental domestic net import expenditure (import expenditure minus export revenue) from the proposed Regulations would be zero under the CBA, though significant and varying trade impacts would be felt province to province as shown in Table 26.
| Province | 2024-2030 | 2031-2035 | 2036-2040 | 2041-2045 | 2046-2050 | 27-year total | Annualized average (n=27) |
|---|---|---|---|---|---|---|---|
| NL | 2 | -31 | -825 | -770 | -1,445 | -3,068 | -148 |
| PE | 0 | 5 | 61 | 171 | 118 | 355 | 17 |
| NS | -10 | -52 | -448 | -342 | -690 | -1,542 | -74 |
| NB | 65 | 584 | 945 | 115 | 777 | 2,486 | 120 |
| QC | -67 | -540 | 337 | -1,562 | -2,139 | -3,971 | -192 |
| ON | 21 | 430 | 1,552 | 4,143 | 4,613 | 10,759 | 520 |
| MB | -11 | -408 | -1,621 | -1,673 | -910 | -4,623 | -223 |
| SK | -1 | 370 | 1,745 | 1,608 | 1,271 | 4,993 | 241 |
| AB | 73 | 917 | 3,475 | 4,342 | 7,538 | 16,344 | 789 |
| BC | -72 | -1,276 | -5,222 | -6,033 | -9,134 | -21,737 | -1,050 |
| YK | 0 | 0 | 1 | 1 | 1 | 3 | 0 |
| NT | 0 | 0 | 0 | 0 | 0 | 0 | 0 |
| NU | 0 | 0 | 0 | 0 | 0 | 0 | 0 |
| Total | 0 | 0 | 0 | 0 | 0 | 0 | 0 |
To get a sense of the overall cost impact of the proposed Regulations to each province, the total cost savings to provinces (avoided fuel usage, variable O&M and refurbishment) were subtracted from the total costs to provinces (capital costs for new electricity system capacity, capital costs for new transmission lines, fixed O&M, residual value of capital on early retirements, net international imports, net domestic imports and administrative costs) to obtain total net costs per province (Table 27). Positive values represent incremental net costs to provinces while negative values represent incremental net cost savings to provinces. Normalized by provincial GDP, the provinces that would incur the greatest amount of net costs are New Brunswick, Saskatchewan and Alberta, while the provinces that would incur the greatest amount of net cost savings are British Columbia and Newfoundland and Labrador.
| Province | 2024-2030 | 2031-2035 | 2036-2040 | 2041-2045 | 2046-2050 | 27-year total | Annualized average (n=27) | Measure of relative cost by size of economy table d12 note * |
|---|---|---|---|---|---|---|---|---|
| NL | 2 | 28 | -273 | -627 | -95 | -964 | -47 | -1,190 |
| PE | 0 | 80 | 50 | 167 | 116 | 412 | 20 | 2,419 |
| NS | 1,672 | 3,584 | -313 | -71 | -1,695 | 3,177 | 153 | 3,089 |
| NB | 49.1 | 531 | 1,986 | 4,774 | 1,037 | 8,377 | 405 | 9,910 |
| QC | 4 | 176 | -318 | -579 | -478 | -1,194 | -58 | -118 |
| ON | -60 | 5,579 | 9,896 | 481 | 3,457 | 19,353 | 935 | 968 |
| MB | 1 | 425 | -286 | -115 | 329 | 353 | 17 | 210 |
| SK | 346 | 2,416 | 3,687 | 1,155 | 3,600 | 11,204 | 541 | 5,292 |
| AB | 2,642 | 17,010 | 4,061 | 5,064 | 5,918 | 34,694 | 1,675 | 3,906 |
| BC | -58.2 | 1,109 | -4,562 | -5,303 | -8,034 | -16,848 | -814 | -2,404 |
| YK | 0 | 0 | 1 | 1 | 1 | 3 | 0 | 31 |
| NT | 0 | 0 | -2 | -2 | -2 | -6 | 0 | -51 |
| NU | 0 | 0 | 0 | 0 | 0 | 0 | 0 | 0 |
| Total | 4,598 | 30,938 | 13,928 | 4,944 | 4,154 | 58,561 | 2,828 | N/A |
Table d12 note(s)
|
||||||||
Analysis of electricity rates
Generally speaking, residential electricity rates consist of a fixed rate portion and a variable rate portion. The fixed rate portion considers capital investment while the variable rate portion considers costs of generation. For the purpose of the CBA, it is assumed that the majority of costs incurred by electric utilities would be ultimately passed onto consumers through this pricing mechanism, in a manner that is specific to each province (given that electricity rates are a matter of provincial policy and are determined at the provincial level). In most cases, it is expected that investment into low and non-emitting generation technologies would increase the fixed rate portion of a household’s electricity bill and decrease the variable rate portion. Where, according to provincially determined rate-setting approaches, increases to fixed rates are applied equally across all consumers regardless of electricity usage, lower-income households would pay a higher proportion of their household income to cover these costs relative to higher income households.
Under the proposed Regulations, while the variable costs of generation would decrease for several provinces, most provinces would first be expected to undertake significant capital investment to construct new low- or non-emitting electricity generation capacity and new transmission lines. As would typically be the case in covering the costs of capital assets, such investment would be financed and paid back to lenders, thereby smoothing out the payments made on this capital over time.
E3MC was used to model the impact that the proposed Regulations may have on electricity rates to different segments of the economy over time. Such rates are generated by E3MC endogenously, using a complex formula that draws in results from other modelled variables such as purchases, sales, imports, exports, energy-related credits and taxes, and non-power costs. It should be noted that residential electricity rates generated by E3MC do not take province-specific rate-setting formulas into account, such as rate caps that may exist in some provinces. As such, the rate impacts modelled by E3MC may potentially overestimate the amplitude of rate increases or rate decreases. Ultimately, the cost of the electricity system in each province and the impact of that system on rates will be a reflection of decisions made at the provincial level in response to the proposed Regulations, which have the potential to vary from the impacts modelled by E3MC. It is also important to note that rate modelling in E3MC does not differentiate between changes to the fixed rate portion of an electricity bill versus the variable rate portion. Accordingly, rate increases modelled by E3MC represent average electricity bill increases across both dimensions, presented on a per kWh basis.
In the baseline scenario, the construction of new infrastructure (and operation of that modelled electricity system) would have been associated with average real residential electricity rate increases of 43% between 2025 and 2050 cumulatively. By contrast, in the regulatory scenario, the construction of new infrastructure (and operation of that modelled electricity system) would be associated with average real residential electricity rate increases of 45% between 2025 and 2050 cumulatively. The incremental change in real residential electricity rates (i.e. the change in rates that are attributable to the proposed Regulations) is only that captured by the difference in rates between the baseline and regulatory scenarios. Alternative impacts on rates following a different methodology than under the central case modelling is explored in the sensitivity analysis. The sensitivity analysis explores the rate-impacting costs that follow from a modelling approach differing from that used under the central case modelling.
Under the proposed Regulations, E3MC modelling estimates that national average residential rates (in undiscounted 2022 constant dollars) would increase relative to the baseline scenario by 0.08 cents per kWh in 2035 (0.35% increase), 0.49 cents per kWh in 2040 (1.9% increase), 0.35 cents per kWh in 2045 (1.2% increase), and 0.26 cents per kwh in 2050 (0.89% increase). The majority of provinces and territories are expected to experience rate increases well below the national average, with some exhibiting rate reductions relative to the baseline. However, for provinces that currently rely more heavily on emitting technology to generate electricity, higher incremental rate increases are expected. For example, in 2040, E3MC modelling estimates that residential rates would increase relative to the baseline scenario by 3.9 cents per kWh in Nova Scotia (15% increase), 1.2 cents per kWh in Alberta (5% increase), 0.9 cents per kWh in Saskatchewan (3% increase), and 0.4 cents per kWh in New Brunswick (2% increase). E3MC modelling suggests that by 2050, incremental rate impacts will lessen at the national level from their high in 2040. For example, in 2050, E3MC modelling estimates that residential rates would increase relative to the baseline scenario by 2.6 cents per kWh in Nova Scotia (9% increase, 1.2 cents per kWh in Alberta (4% increase), and 1.1 cents per kWh in Saskatchewan (3% increase), while residential rates would decrease relative to the baseline scenario by 1.2 cents per kWh (4% decrease) in New Brunswick.
To put these modelled residential rate changes in context, the average single-detached home used 12,555 kWh of electricity in 2019 while the average high-rise apartment used 7,222 kWh of electricity.footnote 31 Holding these usages constant and using them to form an illustrative range, national average annual electricity payments at the residential level could peak to an increase of $35 to $61 per household in 2040. However, relative to the baseline, national average annual electricity payments would only be $19 to $33 higher per household in 2050. It is important to note that such changes in national average annual electricity payments would be incremental to other increases expected in the baseline scenario. As is the case with incremental rates denoted above, provinces that currently rely more heavily on emitting technology to generate electricity are expected to experience greater increases to annual electricity payments relative to the baseline which would peak in 2040 but decrease somewhat for most provinces by 2050. For example, average annual incremental electricity payments at the residential level could be $279 to $485 higher in Nova Scotia in 2040 compared to the baseline, but only $185 to $322 higher in 2050. In 2040, while such payments would be expected to be $88 to $154 higher in Alberta relative to the baseline but only $86 to $149 higher in 2050. In 2040, such payments would be expected to be $32 to $55 higher in New Brunswick relative to the baseline (in line with the national average) but would be $88 to $153 lower than the baseline in 2050. In 2040, such payments would be expected to be $64 to $111 higher relative to the baseline in Saskatchewan and $79 to $137 higher in 2050.
E3MC modelling estimates that incremental commercial and industrial rate changes in each province would follow a similar pattern and magnitude as residential rate changes (i.e. a 2.2% increase for commercial rates and 2.8% increase for industrial rates in 2040 and a 1.1% increase for commercial rates and 1.3% increase for industrial rates in 2050.
While the proposed Regulations are expected to increase electricity rates relative to the baseline scenario, these increases must be understood within the context of overall energy budgets, which are expected to be significantly impacted by the full suite of measures being put in place to support the clean electrification of the economy. For example, while households may see electricity rate increases, they would also experience cost savings and greater price certainty as they transition to clean electricity from increasingly costly fossil fuels to heat and cool their homes and to power their vehicles. As noted by the Canadian Climate Institute, “Increased household electricity use will correspond with decreased use of gasoline, natural gas, and other fossil fuels. While spending on electricity will likely increase, total energy spending will decline.”footnote 32 While assessing the impact of a full suite of measures on overall household energy budgets is out of scope for the CBA, such line of inquiry is explored in the Gender Based Analysis Plus section.
Analysis of household electricity demand
Household electricity demand and by extension, the rate at which households are expected to electrify, may be affected by the changes to residential electricity rates induced by the proposed Regulations. In response to higher electricity prices, consumers may shift their behaviour over time to reduce the amount of electricity that they use. For example, some households may respond by investing in more energy-efficient technologies and more energy-efficient homes. Alternatively, some households may respond by substituting from electricity to other sources of energy. Some households may also respond by decreasing the amount of electricity-dependent activities that they partake in (or reduce the hours spent on those activities). The particular behavioural shifts that a household would undertake depend on many factors such as price elasticity of demand (how sensitive household electricity usage is to price), price and availability of substitute energy sources and individual preferences.
Outputs from E3MC were used to assess the potential impact of the proposed Regulations on household electricity demand and electrification. Table 28 depicts total residential electricity demand as a proportion of total residential energy demand in the baseline scenario versus in the regulatory scenario in select years.
| Province | Baseline scenario proportion (2025) | Regulatory scenario proportion (2025) | Baseline scenario proportion (2050) | Regulatory scenario proportion (2050) |
|---|---|---|---|---|
| NL | 30.0% | 30.0% | 37.2% | 37.2% |
| PE | 12.1% | 12.1% | 33.6% | 33.7% |
| NS | 25.7% | 25.7% | 52.1% | 51.0% |
| NB | 34.9% | 34.9% | 50.3% | 50.6% |
| QC | 42.7% | 42.7% | 75.1% | 75.0% |
| ON | 16.9% | 16.9% | 29.5% | 29.4% |
| MB | 30.5% | 30.5% | 44.9% | 44.8% |
| SK | 10.9% | 10.9% | 14.9% | 14.7% |
| AB | 12.8% | 12.8% | 22.5% | 22.0% |
| BC | 23.8% | 23.8% | 44.5% | 44.4% |
| YT | 19.7% | 19.7% | 50.3% | 50.3% |
| NT | 7.7% | 7.7% | 11.4% | 11.4% |
| NU | 6.5% | 6.5% | 9.2% | 9.2% |
| Average | 21.1% | 21.1% | 36.6% | 36.4% |
As depicted in Table 28, electrification at the household level is expected to be significant in the baseline scenario, with households in several provinces expecting to double their proportion of electricity demand relative to total energy demand between 2025 and 2050. Such proportions are nearly identical between the baseline scenario and regulatory scenario, indicating that the proposed Regulations would not have a significant impact on the rate at which households are expected to electrify. Indeed, under the proposed Regulations, E3MC modelling estimates that national residential electricity demand would only decrease by around 1,000 GWh in 2050 (roughly 0.4% decrease from baseline electricity demand in that year). As such, substitution is not assessed to be a source of concern in the analysis and any potential consumer welfare impacts and GHG emissions that may be associated with these minor shifts in behaviour have not been assessed in the CBA.
Sensitivity analysis
The Department has conducted a two-part sensitivity analysis on the proposed Regulations using its Next-Grid model, as well as a third part comparing key input costs used between NextGrid and E3MC. The first part assesses the impact that a higher demand for electricity would have on provincial electricity system mixes, emissions and total costs. The second part explores the effect of modifying various aspects of the proposed Regulations design including the level of the performance standard, the mass-based/duration flexibility provisions, the electricity generation capacity threshold, the inclusion of industrial units and the End of Prescribed Life. In all cases, the Regulatory scenario is compared to a baseline scenario, where the baseline scenario includes an increase in demand of 1.4 times over current demand by 2050 and all announced policies, excluding those announced in Budget 2023, for the electricity sector (the Regulations Amending the Reduction of Carbon Dioxide Emissions from Coal-fired Generation of Electricity Regulations, the Regulations Limiting Carbon Dioxide Emissions from Natural Gas-fired Generation of Electricity and carbon pollution pricing as it applies to electricity generation via the Output-Based Pricing System Regulations or OBPS). The comparison is performed for the low demand scenario, modelled as 1.4 times (“1.4 X”) increase over current demand by 2050 and used in the CBA and for the high demand scenario, modelled as 2.5 times (“2.5 X”) increase over current demand by 2050. Since this sensitivity analysis on the proposed Regulations was conducted using the NextGrid model, these results cannot be combined with the results presented in the CBA, which uses the E3MC model.
Part 1
Changes in the mix of technologies deployed to meet demand
The Canadian Climate Institute recently reviewed a range of studies that estimate that achieving a net-zero economy will require an increase in overall electricity generation to become 1.6 to 2.1 times greater by 2050 compared to 2020 levels. Other studies had previously estimated that electricity demand would triple by 2050. Considering the difficulty of accurately predicting future growth in electricity demand, the Department chooses to assess sensitivities using a “bookend” approach that assess outcomes for a low and high demand scenario consistent with this independent work. In this context, the 2.5 demand increase (“2.5 X”) represents a conservative, high bookend estimate that is intended to capture all of the electricity demand growth that would be seen under a net-zero economy. Conversely, the low demand scenario (“1.4 X”) assumes modest growth in electrification of other sectors, meaning that a greater share of the energy supply in decarbonization is coming from sources other than electricity, e.g. hydrogen. The actual load growth in Canada will depend on the extent to which Canadians ultimately come to rely on clean electricity for economy-wide decarbonization by 2050. A heavy reliance on clean electricity, i.e. high demand growth, will result in a greater need for non-emitting electricity generating capacity by 2050 while a minor reliance on clean electricity, i.e. low demand growth, will likely result in relatively less deployment of non-emitting capacity. Not only would this have an impact on the capacity and generation mix in the electricity sector in 2050, it would also affect the resultant costs seen by generators and consumers and thus should be explored in this analysis of the impacts of the proposed Regulations.
The NextGrid model was used to project the mix of supply options that would be deployed by 2050 to supply the load growth scenario used in the cost-benefit analysis (i.e. 1.4 X current demand) and compared that to the mix that would arise under a 2.5 X scenario, which is similar to demand growth projections in recent literature.footnote 33 This electricity system mix assessment was conducted for Canada as a whole, as well as for Alberta, Saskatchewan, Ontario, Nova Scotia and New Brunswick, as these are the provinces that currently have significant amounts of fossil fuel-based capacity that would become subject to the proposed Regulations. In comparing the electricity system mixes of the 2.5 X scenario to those of the 1.4 X scenario, it would appear that under the proposed Regulations, the same technologies would, in general, be deployed regardless of the demand scenario, but more capacity would be deployed in the higher load scenario. This results in a cleaner electricity system on a per MWh basis, as the new deployments are largely low or non-emitting units. This is the expected result, as NextGrid optimizes for lowest cost on a deployed technology basis (i.e. the optimal solution of deployed technologies scales in accordance with the scaled need for the same technologies). This same relation is seen for generation.
Changes in total emissions
In moving from a scenario in which the proposed Regulations regulate the emissions from meeting demand that is 1.4 X current to a scenario in which demand is 2.5 X current, it would be expected to see more emissions under the 2.5 X scenario. This is the expected outcome since, even though the proposed Regulations significantly reduce emissions from each unit, more units are required to meet more demand and hence there are more emissions at the jurisdictional level. This expected trend is generally seen in the sensitivity analysis, summarized in Table 29. Overall, the proposed Regulations are largely expected to be as effective under a 2.5 X scenario as it would be under a 1.4 X scenario. This is largely due to NextGrid projecting that increased demand would be predominately met with non-emitting generation whose variable nature is stabilized by a combination of increased interprovincial electricity trade, energy storage, demand response and rarely used fossil fuel-fired generation. Differences are, however, seen at the provincial level. Notably, Quebec and Nova Scotia would see greater reductions under a 2.5 X scenario than under a 1.4 X scenario. Since this sensitivity analysis on the proposed Regulations was conducted using the NextGrid model, these results cannot be combined with the results presented in the CBA, which uses the E3MC model. The 1.4 X scenario was provided here to provide a reference point to the 2.5 X scenario results.
| Jurisdiction | Percent change in emissions in the proposed Regulations – 1.4 X scenario relative to baseline scenario (2025-2050) | Percent change in emissions in the proposed Regulations – 2.5 X scenario relative to baseline scenario (2025-2050) |
|---|---|---|
| CAN | -28% | -32% |
| BC | -10% | -9% |
| AB | -26% | -27% |
| SK | -38% | -38% |
| MB | -55% | -38% |
| ON | -35% | -40% |
| QC | -39% | -70% |
| NB | -10% | -1% |
| NS | -1% | -71% |
| NL | -9% | -9% |
| PE | 0% | -0% |
Changes in total costs
The percent change in total costs under the proposed Regulations for a 1.4 X and 2.5 X demand growth scenario are summarized in Table 30. Given the lower costs of non-emitting generation, transmission and demand response relative to abated emitting generation, NextGrid projects that scenarios with higher demand would see disproportionately more of this demand met with non-emitting sources. Therefore, the proportional cost increases above baseline scenario for the lower demand scenario are roughly constant with those of the higher demand scenario. Since this sensitivity analysis on the proposed Regulations was conducted using the NextGrid model, these results cannot be combined with the results presented in the CBA, which uses the E3MC model. The 1.4 X scenario was provided here to provide a reference point to the 2.5 X scenario results.
| Jurisdiction | Percent change in total costs in the proposed Regulations – 1.4X scenario relative to BAU | Percent change in total costs in the proposed Regulations – 2.5X scenario relative to BAU |
|---|---|---|
| CAN | 5% | 4% |
| BC | 3% | 1% |
| AB | 4% | 2% |
| SK | 7% | 4% |
| MB | 8% | 3% |
| ON | 6% | 4% |
| QC | 4% | 5% |
| NB | 2% | 0% |
| NS | 4% | 3% |
| NL | 4% | 13% |
| PE | 7% | 3% |
Average electricity prices were calculated from NextGrid cost outputs by incorporating to them the costs for utility debt, distribution and transmission costs and other considerations for the final costs borne by consumers. These average prices account for volumetric electricity rates and fixed charges.
Based on NextGrid cost results for the 1.4 X scenario, calculated average electricity prices increase by 0.7 cents per kWh (4.0%) in 2035 and 0.7 cents per kWh (4.0%) in 2050, expressed as a simple average at the national level and relative to the baseline. Similar small relative increases in average electricity prices are also seen in the 2.5 X scenario, with electricity prices increasing by 0.6 cents per kWh (4.0%) in 2035 and 0.3 cents per kWh (1.0%) in 2050. Similar to the E2020 results under a 1.4 X growth scenario, most provinces show small changes in residential electricity prices relative to the baseline although some provinces do show a more significant impact in electricity prices relative to the baseline (Nova Scotia, Prince Edward Island and Newfoundland and Labrador).
Since the above findings are on the basis of the differences between electricity prices in the regulatory scenario and the baseline scenario being arithmetically averaged over the ten provinces, the resulting national average treats the volume of electricity in each province as being equal. This is not the case in reality, as load varies significantly between provinces. If the national average electricity price is weighted by load, the resulting weighted average gives a closer sense of the impact of the proposed Regulations at the national level. The weighted average findings indicated a price increase of 0.3 cents per kWh (2.2%) in 2035 and 0.1 cents per kWh (0.8%) in 2050 for the 1.4X scenario. For the 2.5 X scenario, the price increases are approximately the same.
Further analysis to understand these impacts is being conducted on data results from E2020 and NextGrid to ensure that robust conclusions are made that consider a range of cost outcomes.
Overall findings
Relative to lower demand scenarios, it can be expected that the proposed Regulations, under higher demand scenarios, would
- help produce electricity systems with the same types of non-emitting technologies;
- be as effective in emissions reductions; and
- have similar total cost differences (in percentage) from the baseline scenario.
Part 2
The second part of the sensitivity analysis assesses the impacts on costs and emission reductions that would result if the following elements of the proposed Regulations were made more stringent or lenient:
- Performance standard: Proposed value is 30 t/GWh; sensitivity analysis considers 0 t/GWh and 100 t/GWh;
- Units operating under the mass-based emission/duration flexibility: It is proposed that the generation contribution of these units under the mass-based emission/duration flexibility be constrained to the yearly limits of 450 hours (approximately equivalent to 5% utilization), and 150 kt of emissions. The sensitivity analysis considers i) not allowing for any usage of this flexibility such that reliability must be ensured by non-fossil options and, ii) allowing utilization up to 10%;
- Electricity Generation Capacity Threshold: Proposed value is 25 MW; sensitivity analysis considers 2.5 MW and 50 MW. For clarity, only units with a capacity above the threshold would be subject to the proposed Regulations;
- Treatment of industrial units: Proposed approach would only require those industrial units that have net exports to a NERC-regulated electricity system in any given year to comply with the performance standard. Sensitivity analysis considers an approach in which all industrial generation is subject to the proposed Regulations and an approach in which no industrial generation is subject to the proposed Regulations; and
- Prescribed Life period: Proposed value is 20 years; sensitivity analysis considers 0, 15, 25, 30, 35, 40 and 45 years.
Sensitivity of each of the above parameters were assessed by running the NextGrid model with the proposed regulatory case having only one of the above parameters changed at a time. Impacts to costs and emissions are presented as percent change relative to the proposed regulatory case. More specifically:
The effect on the cost of the proposed Regulations is provided as
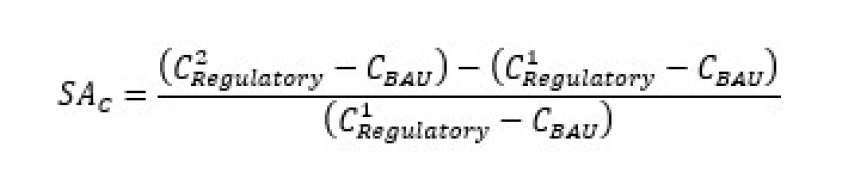
Eq. 1
where CBAU, Cfootnote 1Regulatory and Cfootnote 2Regulatory represent the cumulative (2025 to 2050) discounted costs of the baseline scenario, Regulatory and Modified Regulatory scenario, respectively.
The effect on emission reductions is provided as
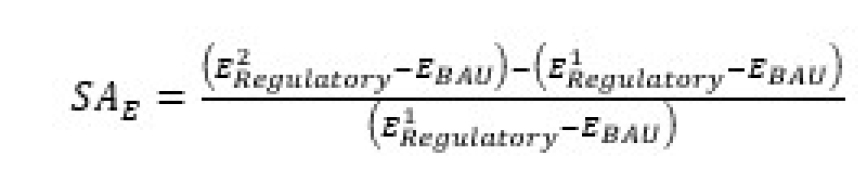
Eq. 2.
where EBAU, Efootnote 1Regulatory and Efootnote 2Regulatory represent the cumulative (2025 to 2050) emissions of electricity generation the baseline scenario, Regulatory and Modified Regulatory scenario, respectively.
The following caveats are important in the consideration of the sensitivity findings:
- The costs are cumulative, discounted (using a 3% discount factor as opposed to the 2% used in the CBA) and annualized. The 3% discount factor was used to assess its impact on the resulting grid mixes (i.e. the observed combination of various generating sources that supply a NERC-regulated electricity system) and was found to have no discernable effect. While they have a large scope (they include the cost of new capital, fuel, fixed operations and maintenance (FOM), variable operations and maintenance (VOM), carbon, residual value of capital on early retirements and Variable Renewable Energy (VRE) integration costs), they exclude a number of items: cost for intra-provincial transmission, distribution, financing and any capital cost associated with assets already built out in 2022; and
- The findings assume that units that are required to comply with the emissions intensity limit under the proposed Regulations receive full exposure to the carbon price (170$/tonne CO2e) starting in 2035.
- Since this sensitivity analysis on the proposed Regulations was conducted using the NextGrid model, these results cannot be combined with the results presented in the CBA, which uses the E3MC model.
Effects of varying the stringency of the performance standard
The proposed Regulations would require units to meet, with some exceptions, a performance standard of 30 t/GWh. To assess the sensitivity of the proposed Regulations’ expected costs and emission reductions, this performance standard was assessed at 0 t/GWh (i.e. equivalent to a de facto ban on fossil fuel-fired generation at their End of Prescribed Life) not allowing for these units to provide backup services for variable renewables or to install CCS and 100 t/GWh (which would avoid the proposed Regulations needing to provide time for the new CCS units to adapt to the stringent 30 t/GWh standard, i.e. 100 t/GWh on an annual average basis is easily obtainable by any CCS unit).
The more stringent approach of 0 t/GWh was found to increase costs by 20% and 18% for the 1.4X and 2.5X scenarios respectively while also increasing emission reductions by approximately 2% and 3% in the same respective demand scenarios. This more stringent approach thus does not seem to be a cost-effective approach for incremental reductions. The less stringent approach of a 100 t/GWh performance standard would not dramatically reduce expected costs (4% and 5% reduction for the 1.4X and 2.5X scenarios respectively) and potentially increase emissions by about 12% for each or the 1.4X and 2.5X scenarios. This sensitivity analysis suggests that the proposed performance standard of 30 t/GWh results in emissions reductions without dramatically increasing costs.
Effects of varying the duration of the mass-based emission/duration flexibility provisions
The proposed Regulations include exceptions to the 30 t/GWh performance standard for units that operate for less than 450 hr/yr and emit less than 150 kt/yr. For reference, 450 hours per year is equal to approximately 5% of the total hours in a year assuming operation at 100% capacity. This approach provides an important tool to regulatees to preserve the reliability of the electricity system by using units that meet these conditions to provide backup or peaking power and at potentially lower costs if the alternative means of producing this reliability power would be to build new capital projects. To assess the sensitivity of the proposed Regulations’ expected costs and emission reductions, this mass-based emission/duration flexibility was assessed at 0% utilization (i.e. equivalent to not allowing for these units to provide backup services for variable renewables) and at 10%; for the purpose of analysis, units using this flexibility were assumed to operate at 100% capacity. Additional assessment was conducted to determine the impacts of 8% utilization.
The more stringent approach of 0% utilization was found to increase costs by 12% and 33% for the 1.4X and 2.5X scenarios respectively while also increasing emission reductions by approximately 11% in both demand scenarios. This appears to indicate that seeking further emission reductions by constraining the use of emitting units to provide backup/peaking power to less than 450 hr would not provide further reductions while costs would continue to increase with increasing electricity demand. This finding suggests that 450 hr is likely the minimal value that should be considered. In this context, analyses indicated that the less stringent approach of a 10% utilization factor would not dramatically reduce expected costs (i.e. 3% and 1%, respectively, for the 1.4X and 2.5X scenarios) and would result in a proportionately higher loss of emission reductions (i.e. 6% and 15%, respectively, for the 1.4X and 2.5X scenarios). The assessment of 8% utilization for the 1.4X demand scenario indicated a reduction of costs of only 2% relative to 450 hours and a loss of emission reductions of ~4% This sensitivity analysis suggests that the proposed values of 450 hours and 150 kt provide the best balance of cost savings and emissions reductions.
The Department invites interested parties to provide specific, evidence-based comments and any data relevant to this important flexibility prior to the publication in the Canada Gazette, Part II. While the objective of the proposed Regulations is to reduce CO2 emissions from the generation of electricity, it is also important that Canada’s electricity supply remains reliable and affordable as this supports both the safety of Canadians and attaining Canada’s goal of a net-zero GHG emission economy by 2050.
Effects of varying the value of the electricity generation capacity threshold value
Fossil fuel-fired electricity generating units that do not exceed a capacity of 25 MW would not be subject to the proposed Regulations. This approach avoids costs associated with units that have historically not been a major source of GHG emissions in Canada, while also providing flexibility for electricity system operators in locations where there may not be sufficient infrastructure. It would also reduce the cumulative cost to unit operators of complying with the regulations while also not sacrificing a significant amount of carbon emission reductions.
The effect on the cost of the proposed Regulations and on associated emission reductions were calculated for a more stringent threshold of 2.5 MW as well as for a less stringent threshold of 50 MW.
The more stringent threshold of 2.5 MW would have a negligible effect on both costs and emission reductions for both load scenarios. The small gains in emission reductions (on the order of 1%) do not warrant the very significant increase in the number of regulatees implementing the regulation, nor the loss of flexibility for operators in locations where there may not be sufficient electricity system infrastructure.
The less stringent threshold of 50 MW would decrease the cost of the proposed Regulations by 3% while also reducing the emission reductions by approximately 5% for both load scenarios. While the proportional decrease in costs to the loss of emission reductions is on par with the proposed approach, the greater generation capacity threshold of 50 MW might, result in a build out of units slightly less than 50 MW as a means to avoid being subject to the proposed Regulations. Although a similar avoidance pattern is theoretically possible with the proposed value of 25 MW, a fleet comprised of units each less than 25 MW would be expected to have a greater logistical inefficiency compared to a fleet comprised of units each less than 50 MW. This greater logistical inefficiency is deemed sufficient to discourage an appreciable build out of units slightly smaller than 25 MW. As such, the proposed approach of a 25 MW electricity generation capacity threshold is seen as the better approach.
Effects of varying the extent to which industrial generation is included within the scope of the proposed Regulations
The Proposed Regulations would apply to industrial units that meet the applicability criteria including being connected to a NERC-regulated electricity system. However, only units that have net exports in any given year would need to comply with the performance standard. This approach is expected to prevent a rush to generate electricity for sale to a NERC-regulated electricity system using industry-owned unabated fossil fuel-fired electricity generating units; the approach also relies on other instruments – that are tailored to specific industrial sectors – to reduce emissions associated with electricity generated solely for industrial activity.
The sensitivity of estimated costs and emission reductions to the proposed approach were analyzed for two alternative coverages of industrial units: a more stringent policy design in which all industrial units are fully covered regardless of whether or not they export to a NERC-regulated electricity system and a less stringent policy design in which industrial units are fully exempt from meeting the performance standard.
While the associated emission reductions of this more stringent approach are very high (105% and 80% higher for the 1.4X and 2.5X load scenarios, respectively), covering all industrial electricity generation units also significantly increases the cost of the proposed Regulations by 87% and 62% for the 1.4X and 2.5X load scenarios, respectively. This cost increase only considers the cost of generating electricity and industrial heat from cogeneration units and does not assess the secondary impacts that such costs could have on industrial activity specifically (e.g. potentially suppressing economic activity, reducing competitiveness, etc.) and on the Canadian economy more generally. As a result, this particular finding should not be considered as sufficient rationale for having all industrial generation subject to the performance standard in the proposed Regulations. Alternately, not making industrial generation subject to the proposed Regulations represents a scenario in which industrial generation can sell fossil-fired electricity on to the electricity system without limit. This approach would not significantly reduce the proposed Regulations’ cost (2% for the 1.4x and 1% for the 2.5x scenarios) but would decrease the emission reductions by a noticeably higher amount: 35% and 26% for the 1.4X and 2.5X load scenarios, respectively. This analysis did not consider the potential of electricity moving from being generated by utility-owned units to being generated by industrial units firing on fossil-fuels unabated; by not considering this, the foregone emission reduction finding is likely biased, i.e. the forgone emission reductions are underestimated and would likely be higher than 35% and 26%. This finding indicates that the proposed approach of the proposed Regulations covering net-exporting industrial units is likely the better approach of the considered alternatives as it is less likely to produce broader economic impacts but is also one that results in low-cost emission reductions from the perspective of a whole economy.
Effects of varying the End of Prescribed Life
The proposed Regulations allow units commissioned before January 1, 2025, to continue operating without being required to meet an emission intensity limit until the end of the unit’s prescribed life, proposed to be set at 20 years, or January 1, 2035, whichever comes later. This approach phases-in the activity needed to support a net-zero electricity system, thereby avoiding a steep capacity drop in 2035 while making sure that unabated fossil fuel-fired electricity generating units comply with the Regulations well in advance of 2050.
The effect on the cost of the proposed Regulations and on associated emission reductions were calculated for a suite of alternative numbers of years, from 0 years (i.e. existing units must meet the performance standard in 2035, just like new units) to 45 years (i.e. units are allowed to operate until the end of their technical life).
Setting the duration of the prescribe life to 0, 5, 10 or 15 years resulted in similar outcomes: The cost of the proposed Regulations in a 1.4X load scenario increases by about 8% but only increases emission reductions by 3%. For a 2.5X load scenario, the increase in cost is negligible and the emission reductions are only increased by 2%. Given the increased logistical difficulty that could be reasonably expected with an accelerated buildout of new capacity needed to ensure system reliability and the relatively small gain in emission reductions, decreasing the number of years that existing units can operate after commissioning does not seem to be advantageous.
Alternately, allowing existing units to operate for 35 to 45 years after commissioning dates does reduce the cost of the proposed Regulations, but at the detriment of significant losses in emission reductions. For the 1.4X load scenario, costs decrease by 14% to 77% for 35 to 45 years of operation, but emission reductions also decrease by 25% to 76%. For the 2.5X load scenario, the cost decrease associated with a prescribed life period of 35 to 45 years is 10% to 53%, but at the expense of 14% to 31% fewer emission reductions.
More moderate lengthening of the prescribed life period (i.e. to 25-30 years) is associated with moderate cost increases of the proposed Regulations. For the 1.4X load scenario, these increases range from 1% to 6% for 25 and 30 years, while these increases are from 4% to 2% for the same years in the 2.5X load scenarios. These increases in costs are accompanied by moderate losses in emission reductions: 4% and 12% for 25 and 30 years in the 1.4X scenario and by 3% and 7% for the same number of years in the 2.5X load scenario.
This indicates that the proposed length of 20 years of operation is the best option, balancing the phasing in of the regulation for reliability, managing costs and not sacrificing a substantial amount of emission reductions. However, if other considerations, such as logistical realities constraining the rate at which new capacity could be build-out, were to be demonstrated as a valid concern, longer prescribed life periods of no more than 30 years would not be expected to have significant impacts on the expected emission reductions of the proposed Regulations.
Part 3
The third part of the sensitivity analysis tests the total cost impact of using different input costs for key variables than those used in the central case modelling. In the CBA, total costs are sensitive with respect to one variable in particular: the marginal capital cost (per MW) of greenfield construction for electricity system technologies (marginal capital costs). This variable determines the scale of the cost impact associated with new capital buildout of predominantly abated emitting and non-emitting electricity generation technologies induced by the proposed Regulations, but also affects the scale of the impact associated with forgone refurbishment and the residual value of capital on early retirements.
The marginal capital costs used in the central case modelling were derived by E3MC. However, these are not the only estimates for capital costs that could be considered in the analysis. As part of the model development process for NextGrid, the Department commissioned an external contract to, among other tasks, compile a projection of marginal capital costs for key electricity system technologies in each province using information from reliable public sources such as the US Department of Energy, the OECD, the Bank of Canada and Canadian utilities. A sensitivity case was generated by mapping the technology types from the external contract to those from E3MC, revealing differences in marginal capital costs between the two approaches (Table 31).
| Technology type | 2025 | 2030 | 2035 | 2040 | 2045 | 2050 |
|---|---|---|---|---|---|---|
| OGCT | -9% | -9% | -9% | -9% | -9% | -9% |
| OGCC | -5% | -5% | -5% | -5% | -5% | -5% |
| Small OGCC table e4 note * | -5% | -5% | -5% | -5% | -5% | -5% |
| NG CCS | -9% | -14% | -21% | -25% | -28% | -31% |
| Nuclear | 41% | 41% | 41% | 41% | 41% | 41% |
| Base hydro | 8% | 8% | 8% | 8% | 8% | 7% |
| Peak hydro | 8% | 7% | 7% | 7% | 7% | 7% |
| Small hydro | -25% | -25% | 8% | 8% | 8% | 7% |
| Biomass | -1% | -12% | -21% | -41% | -41% | -41% |
| Biomass CCS table e4 note * | -3% | -23% | -27% | -31% | -31% | -31% |
| Onshore wind | 1% | 2% | 0% | 1% | 1% | 2% |
| Offshore wind table e4 note * | 1% | 2% | 2% | 2% | 3% | 4% |
| Solar PV | -11% | -10% | -10% | -10% | -9% | -6% |
| Storage | 83% | 113% | 91% | 94% | 97% | 101% |
Table e4 note(s)
|
||||||
The marginal capital costs from the sensitivity case were applied to the same electricity system mix modelled in the central case, generating the following results: relative to the central case over the 27-year analytical period (2024 to 2050), incremental capital costs for new electricity system capacity decreases by $929 million (1.7%), incremental refurbishment cost-savings increases by $115 million (208%) and residual value of capital on early retirements decreases by $98 million (7.8%).
While the sensitivity scenario generates similar total capital costs to the central scenario (i.e. $52.7 billion versus $53.7 billion), changes to the distribution of capital costs amongst provinces is noteworthy. Since natural gas units with CCS and biomass units are less costly in the sensitivity scenario relative to the central scenario, total incremental costs in Nova Scotia and Alberta decrease significantly. Similarly, since nuclear units and peak hydro units are more costly in the sensitivity scenario relative to the central scenario, total incremental costs in New Brunswick increase significantly. Costs to provinces under the sensitivity case are presented in Table 32 below.
| NL | NS | NB | QC | ON | SK | AB | BC | Total | |
|---|---|---|---|---|---|---|---|---|---|
| OGCT | 0 | 37 | -12 | 0 | -2 | -17 | -42 | 0 | -36 |
| OGCC | 0 | 0 | -23 | 0 | -4 | -35 | -85 | 0 | -146 |
| Small OGCC | 0 | -13 | -25 | 0 | -4 | -39 | -93 | 0 | -175 |
| NG CCS* | 0 | 0 | 0 | 0 | 0 | 127 | 643 | 0 | 770 |
| Nuclear | 0 | 0 | 368 | 0 | 0 | 289 | 296 | 0 | 954 |
| Base hydro | 28 | 28 | 38 | 0 | 0 | 5 | 63 | 1 | 163 |
| Peak hydro | 0 | 0 | 0 | 14 | 481 | 0 | 0 | 104 | 599 |
| Small hydro | 23 | 0 | 0 | -3 | 103 | 7 | -98 | 11 | 42 |
| Biomass | 13 | 27 | 18 | 0 | 8 | 3 | 30 | 3 | 101 |
| Biomass CCS* | 0 | 0 | 0 | 0 | 96 | 10 | 6 | 11 | 123 |
| Onshore wind | 19 | 73 | 0 | 2 | -26 | 4 | -28 | 5 | 49 |
| Offshore wind* | 29 | 18 | -0.04 | 0 | 0 | 0 | 0 | 0 | 47 |
| Solar PV | 0 | 2 | 0 | -0.01 | 4 | 8 | 4 | 0.1 | 18 |
| Storage | 8 | 15 | 0 | 2 | 3 | -2 | 9 | 3 | 39 |
| Total | 120 | 187 | 365 | 15 | 658 | 359 | 705 | 138 | 2,547 |
| Percentage difference from central scenario | 12% | -37% | 32% | 6% | 4% | 11% | -14% | 11% | -2% |
Small business lens
The proposed Regulations would not impose any compliance or administrative requirements on small businesses as defined by the Treasury Board Secretariat of Canada (fewer than 100 employees or annual gross revenues below $5 million).
One-for-one rule
The one-for-one rule applies since there is an incremental increase in administrative burden on business. The proposal would repeal two existing regulatory titles, between 2035 and 2045, and introduce a new regulation which would result in a net decrease of one regulatory title. (Policy on Limiting Regulatory Burden on Business). These costs are described in the Administrative Costs subsection of the Benefits and Costs section. Relevant administrative cost inputs shown in Table 22 (i.e. those that would be incurred from 2024 to 2033) were transformed into 2012 constant dollars, then discounted to base year 2012 using a 7% discount rate. Under this methodology, the proposed Regulations would result in an annualized increase in administrative burden of $9,963 or $79.70 per facility. It is important to note that the calculation of burden in under the one-for-one rule does not include administrative costs associated with annual reporting that would begin in 2035 and only includes administrative costs associated with regulatory familiarization and submitting a registration report and registration assignment. The Red Tape Reduction Regulations specify the methodology required to estimate administrative burden costs which is limited to impacts incurred over the 10-year period that starts when the regulations would be registered. These costs are, however, estimated and reported as part of the CBA.
Regulatory cooperation and alignment
The proposed Regulations are a key pillar of the Emission Reductions Plan, Canada’s climate plan to reach net-zero economy by 2050 (NZ2050) and would affect not only the electricity sector but other sectors as they decarbonize with clean electricity. The proposed Regulations would accelerate progress towards a net-zero electricity-generating sector, helping Canada become a net-zero GHG emissions economy by 2050. Canada has joined over 120 countries in committing to be net-zero emissions by 2050, including all other G7 nations. The proposed Regulations would not overlap with provincial or territorial regulations. As electricity is largely a domestic product and is only exported to the US, the only international alignment possible would be with the US. On March 24, 2023, President Biden and Prime Minister Trudeau issued a joint statement in which they referenced commitments by both countries to achieve net-zero electricity systems by 2035, with both countries also indicating their intention to propose regulations before this fall that will reduce greenhouse gas emissions from the North American electricity sector.footnote 34
Modelling analysis to understand potential electricity trade dynamics between the US and Canada under the proposed Regulations will take place between prepublication in the Canada Gazette, Part I and final publication in the Canada Gazette, Part II.
Strategic environmental assessment
In accordance with the Cabinet Directive on the Environmental Assessment of Policy, Plan and Program Proposals, a Strategic Environmental Assessment (SEA) was conducted for the proposed Regulations. The SEA concluded that the proposed Regulations are expected to result in positive environmental effects. Negative environmental effects related to the proposed Regulations could include the localized land-use impacts associated with new solar and wind power projects, or considerations around the storage/disposal of spent fuel from nuclear power plants, as the proposed Regulations are expected to drive increased deployment of low carbon- sources of electricity generation. However, compared to the positive environmental effects from reducing the amount of fossil fuel-based electricity generation in Canada, the potential negative environmental effects would be limited. The proposal supports the 2022-2026 Federal Sustainable Development Strategy (FSDS) goals to “Increase Canadians’ Access to Clean Energy” “Foster Innovation and Green Infrastructure in Canada,” “Take Action on Climate Change and Its Impacts”; “Improve Access to Affordable Housing, Clean Air, Transportation, Parks and Green Spaces, as well as Cultural Heritage in Canada.” The proposed Regulations are also expected to contribute to the related Sustainable Development Goals (SDGs) of the United Nations 2030 Agenda, in particular SDG 3 - Good Health and Well-being; SDG 7 - Affordable and Clean Energy; SDG 9 - Industry, Innovation and Infrastructure; and SDG 13 - Climate Action.
Without the proposed Regulations, under the current regulatory regime, E3MC estimates that the Canadian electricity generation sector would release 44 Mt of emissions in 2030, mostly due to electricity generation from natural gas, which is expected to continue into the 2040s. The proposed Regulations are one component of Canada’s Emissions Reduction Plan. Progress under the plan will be reviewed in progress reports produced in 2023, 2025 and 2027. Additional targets and plans will be developed for 2035 through to 2050.
Gender-based analysis plus
Using a gender-based analysis plus (GBA +), the Department has identified that, relative to the general Canadian population, the proposed Regulations may have disproportionate impacts, both positive and negative, on certain demographic groups. Furthermore, the impacts of climate change will have disproportionate impacts on these same demographics that can also be influenced by regional considerations, such as increased storms for coastal communities or more severe droughts and wildfires in more landlocked, central locations. These impacts may be experienced differently by individuals within these demographic groups and especially by those individuals who have intersecting and overlapping social identities.
The proposed Regulations would accelerate progress towards a net-zero electricity-generating sector, a key element of Canada achieving a net-zero GHG emissions economy by 2050. By virtue of their scope as a federal regulatory instrument, the proposed Regulations can help reduce Canada’s greenhouse gas emissions and contribute to global climate action. As some demographic groups of Canadians are more vulnerable to the adverse effects of climate change than the broader Canadian population, it is the expectation of the Department that these vulnerable demographic groups may feel more greatly any of the positive impacts from the successful mitigation of global climate change.footnote 35,footnote 36 Accordingly, while the proposed Regulations would be beneficial to these demographic groups, the proposed Regulations would include measures to take into account the cost impacts on these same groups.
The proposed Regulations have been designed with several compliance flexibilities, including a mass-based emission/duration flexibility and an end-of-prescribed-life provision. These compliance flexibilities reduce the impacts of the proposed Regulations on costs, for example by lowering the residual value of capital on early retirement of assets. Provinces and Territories are responsible for approving changes to electricity rates and the actual impact of the proposed Regulations on rates would depend on provincial approaches to rate setting as well as sound investment decisions and good planning. However, higher rate impacts are more likely to occur in Alberta, Saskatchewan and Nova Scotia and to a lesser extent in New Brunswick, since their higher reliance on fossil fuel generation would require more capital turnover than in provinces that already have more non-emitting capacity, such as hydro. The Department has estimated electricity rate impacts by province (see analysis of electricity rates section), however, actual incremental impacts of the proposed Regulations on electricity rates would be influenced by provincial decisions on how to meet the regulatory standards. Furthermore, the Department expects that there would be distributional impacts among certain demographic groups and communities within fossil fuel reliant provinces, especially for those experiencing intersectionality.
Even small rate increases could disproportionately impact low-income households because they spend a greater proportion of their income on electricity and are more likely to experience energy poverty. For instance, a scoping paper commissioned by the Canadian Climate Institute found that, across all provinces, electricity expenditures were a larger burden for households with lower income, representing between two and ten percent of their income. In contrast, higher-income households spent between zero and two percent of their income on electricity.footnote 37 Atlantic provinces may be particularly impacted as they typically have the highest rates of energy poverty in Canada.footnote 38 Furthermore, low-income households may not have the ability to purchase technologies that would allow them to benefit from the electrification of end uses (e.g. heat pumps or electric vehicles). The Department is engaging with academics with expertise in the economics of electricity systems to understand the potential impacts of the proposed Regulations on electricity affordability (e.g. electricity rates), total electricity costs seen by households (with consideration for increased electrification) and changes to electricity expenditures as a share of income; however, these potential impacts are expected to be offset by lower household expenditures on fossil fuels, due to electrification of home heating and transportation.footnote 39
The Department intends to factor the findings of this work into its rationale as it continues with engagement and further development of the proposed Regulations. As demonstrated in Budget 2023, the Government of Canada is pursuing a suite of complementary measures that support an affordable and reliable transition to clean electricity and electrification. The above-mentioned electricity affordability study could help inform potential future complementary measures.
Children, youth and future generations stand to face increasingly severe impacts from climate change if it progresses in their lifetimes and therefore, they stand to benefit more than today’s adult generations from emissions reductions over the long-term. The proposed Regulations support intergenerational benefits by accelerating the build-out of clean electricity infrastructure, creating the foundation of the clean electricity grids of the future, which will be a key component of delivering long-term climate benefits to future generations through the emission reduction potential of electrification. While the proposed Regulations and the clean energy transition will have cost impacts on current generations, in general, future generations will benefit from those investments having been made. Moreover, increased access to clean energy can have long-term socioeconomic benefits for future generations by attracting industry and businesses that are increasingly seeking to use clean electricity and reduce operational emissions.
The current composition of the electricity sector labour market in Canada is represented more by certain groups. For example, in 2019, men held 67% of jobs in the electric power generation, transmission and distribution sectorfootnote 40 and accounted for 63% of the workforce in the environmental and clean technology products sector.footnote 41 The economic opportunities presented by a clean energy transition could result in a similar labour market composition. However, Canada is more likely to see a shortage of skilled workers than sustainable jobsfootnote 42 in the clean energy sector and there is an opportunity going forward for the inclusion of those that are currently underrepresented in the electric power generation, transmission and distribution industry, such as women (33%), Indigenous Peoples (3%) and visible minorities (12%).footnote 40 Persons with disabilitiesfootnote 43 and LGBTQ2+ individualsfootnote 44 are also likely underrepresented in the electricity sector, but there is little public disaggregated data to quantify their representation. The federal government’s interim Sustainable Jobs Plan, launched in February 2023, is a mechanism through which these impacts can be mitigated. An integral part of the Sustainable Jobs Plan is ensuring that the unique circumstances of marginalized and underrepresented groups are addressed to ensure their full and equal participation in the economy.
As the proposed Regulations accelerate the clean electricity transition, Canada will see an increase in low- and non-emitting forms of electricity generation (like renewables) and a decrease in emitting forms of electricity generation (like unabated natural gas generation). As this transition occurs, some workers that work with fossil fuel-based electricity generation may need to transition into new jobs. For some workers, this may require learning new skills, adapting career paths and trajectories, or relocating to places where new clean electricity jobs exist. This transition would predominantly impact men as the fossil fuel-based energy sector is male dominated.footnote 40 Older workers may also face unique challenges transitioning to new employment, such as health issues, lack of workplace accommodations and ageism.footnote 45 In 2019, 21% of electric power generation, transmission and distribution sector workers were aged 55 and older and 46% were aged 45 and older.footnote 40
There will be an ongoing role for some fossil fuel-based generation that will still require workers knowledgeable with these systems. In addition, those with experience in fossil fuel-fired electricity generation may possess some transferable skills and knowledge required to work with low-emitting and non-emitting forms of electricity generation. Students, younger workers and future generations may be better positioned to adapt their educational paths and careers to take advantage of a growing clean energy sector. While some workers will not be able to transition from jobs based in fossil-fuel generation, their number is anticipated to be low as the time provided between publication of the proposed Regulations and when the performance standard comes into effect in 2035, as well as the gradual retirement of existing fossil fuel-based generation, can allow time for the sector’s labour force to gain new skills and take advantage of employment opportunities afforded by the clean energy transition.
Indigenous representatives have highlighted that energy affordability and continued access to reliable energy are concerns for Indigenous and remote communities. With this in mind, the proposed Regulations’ compliance flexibilities have been designed to effectively exempt most Indigenous communities and northern, rural and remote communities not connected to a NERC-regulated electricity system, as they often lack affordable options to use non-emitting electricity generation.footnote 46 At the same time, Indigenous representatives have expressed a desire for greater inclusion of Indigenous Peoples’ in the clean energy transition in order to catalyze a transition away from diesel generation and promote local economic opportunities. As the number of Indigenous communities helping to provide clean electricity options in Canada continues to grow, the Government recognizes the substantial contribution that Indigenous communities can play in achieving a net-zero electricity system. The Government also recognizes the important role that the clean electricity transition can play in economic reconciliation. The Government of Canada will continue to engage with Indigenous partners and interested parties to build awareness of clean energy programs and funding opportunities for communities not connected to a NERC-regulated electricity system (i.e. off-grid communities). These efforts will support the Government’s broader commitments to reconciliation and renewed relationships with Indigenous Peoples to achieve the goals enshrined in the United Nations Declaration on the Rights of Indigenous Peoples.footnote 36
Rationale
The proposed Regulations would contribute significantly to Canada’s commitment to achieve net-zero emissions economy-wide by 2050. Achieving net-zero emissions on an economy-wide scale will require broad electrification of sectors and end uses that currently rely on fossil fuels, such as transportation, space and water heating and industrial activity. There is general agreement that the level of electrification needed to achieve the 2050 goal would require at least a doubling of Canada’s electricity supply by 2050. In the baseline scenario, in which the proposed Regulations do not occur, provinces and territories are going to make significant investments in electricity generation and transmission over the next quarter century to meet this growing electricity demand. In this context, the Department estimates that investments of more than $400 billionfootnote 47 are needed as part of routine replacements of aging facilities and to expand generation to respond to increased demands coming from population and economic growth, the switch to electric vehicles, the adoption of electric building heating and the electrification of industrial processes such as steel and aluminum production.
Without further regulatory action, Canada is expected to experience an increase in emissions from the electricity sector.footnote 48 Regulatory action has been determined to be the best approach to send unequivocal signals to transition the economy from fossil fuels to non-emitting sources.
Regulatory action will require commensurate investment. While these investments are expected to lead to increased electricity rates, research suggests that they will support a shift in energy use that will actually reduce overall household energy expenditures. The Climate Change Institute’s Clean Electricity, Affordable Energy (June 2023) concludes that the average household spending on energy will decrease 12% by 2050 as people switch from fossil fuels to more efficient technologies like electric vehicles and heat pumps.
Even though household energy spending is expected to decrease, the Government of Canada also recognizes that electricity must remain affordable. While the incremental cost to ensure that expanded generation occurs in a way that leads toward a net-zero grid is expected to add only a small percentage to the overall cost of electricity, the Government of Canada has committed more than $50B to help decarbonize the sector. This funding could cover more than half of the incremental costs needed to ensure that this transformation leads to a net-zero grid and it provides an opportunity to provinces to greatly reduce the impact on rates, especially in Atlantic Canada and the Prairies.
Together with the suite of complementary federal measures, the proposed Regulations would accelerate Canada on the path to a net-zero electricity sector. While the provinces and territories are responsible for planning and operating their electricity systems, the federal government has jurisdiction to regulate GHG emissions under CEPA. Relative to the baseline scenario, the proposed Regulations would increase non-emitting and abated emitting generating sources and would significantly reduce unabated emitting generation by 2035, nearly completely by 2050.
While existing and planned carbon pricing systems implemented by provincial, territorial and federal governments could reduce emissions from fossil fuel-fired electricity generation, modelling results show that the proposed Regulations are a required driver which would ensure that the sector’s GHG emissions do not unduly increase under a scenario with a high growth in demand for electricity.
The Government of Canada’s approach to addressing climate change is based on the principle of maximizing environmental performance improvements while minimizing adverse economic impacts. The proposed Regulations provide the electricity sector with adequate timelines to adjust their capital investments plans to meet the proposed CO2 emissions standards by 2035.
A societal cost-benefit analysis was conducted for the proposed Regulations, which indicated that they would result in a net reduction of approximately 342 Mt CO2e of GHG emissions between 2024 and 2050 under a central scenario in which electricity demand increases by 40%. The incremental benefit of achieving these reductions is estimated to be $102.5 billion while the incremental cost is estimated to be $73.6 billion over the same period. This results in a net benefit to society of approximately $28.9 billion.footnote 49
If provinces and utilities in Canada were to make a broad commitment to a net-zero electricity grid and take full advantage of federal funding support, the clean electrification agenda is expected to be achieved with minimal additional cost to ratepayers while helping reduce overall household and business energy costs.
Key aspects of the proposed Regulations are presented in Annex 1 of this document, along with the rationale for those aspects
Implementation, compliance and enforcement, and service standards
Implementation
Once the proposed Regulations are published in the Canada Gazette, Part II, departmental staff would lead the development and delivery of compliance promotion activities, as required. This may include posting information on the Web, sending email/letters to regulatees informing them of publication, responding to information or clarification requests, sending reminder letters (as appropriate). The proposed Regulations would come into force on the date in which they are published in the Canada Gazette, Part II, while the performance standard comes into force starting on January 1, 2035.
In general, sectors affected by the proposed Regulations would be familiar with the proposed regulatory requirements due to extensive engagement efforts by the Department in 2022, including multiple webinars (attended by over 400 people, including representatives of industry associations and industry sectors) and documents circulated by the Department that explain the development of the proposed Regulations, meetings between departmental officials and industry and other representatives to inform the evolution of the proposed Regulations, request by the Department for written comments on the proposed regulatory frame and analysis of these comments by departmental staff. Similar engagement activities are planned for 2023.
The Department anticipates publishing the Clean Electricity Regulations in the Canada Gazette, Part II, in 2024. The proposed coming-into-force date would be January 1, 2025. Units that have a commissioning date before January 1, 2025, and meet the applicability criteria will need to register with the Department of the Environment by the end of the 2025 and units commissioned on or after January 1, 2025, will need to register within 60 days of commissioning. Following publication, non-coal units commissioned before January 1, 2025, will need to achieve a 30 t/GWh performance standard starting either January 1, 2035, or January 1 of the year following the unit’s end of prescribed life (20 years after commissioning), whichever is later. Coal units will need to achieve this performance standard starting on January 1, 2035, regardless of their commissioning date. All units that are commissioned on or after January 1, 2025, regardless of the fuel combusted, will need to achieve the 30 t/GWh performance standard starting on January 1, 2035.
Compliance and enforcement
As the proposed Regulations are made under CEPA, Enforcement Officers would, when verifying compliance with the proposed Regulations, apply the Compliance and Enforcement Policy for CEPA. This Policy sets out the range of possible responses to alleged violations, including warnings, directions, environmental protection compliance orders, tickets, ministerial orders, injunctions, criminal prosecution and environmental protection alternative measures (which are an alternative to a court prosecution after the laying of charges for a CEPA violation). In addition, the Policy explains when the Government of Canada will resort to civil suits by the Crown for cost recovery.
Contacts
Karishma Boroowa
Director
Electricity and Combustion Division
Energy and Transportation Directorate
Environment and Climate Change Canada
Email: ECD-DEC@ec.gc.ca
Maria Klimas
Acting Director
Regulatory Analysis and Valuation Division
Economic Analysis Directorate
Environment and Climate Change Canada
Email: RAVD.DARV@ec.gc.ca
| Application | Rationale |
|---|---|
| The proposed Regulations would apply to electricity generating units that meet the three following criteria: | |
| Use any amount of fossil fuels to generate electricity | The need to address climate change requires the limitations of anthropogenic release of CO2, the proposed Regulations would need to cover all potential sources of electricity generation emissions equally. |
| 1. Has a capacity of 25 MW or greater | Avoids costs associated with units that are not expected to be a major source of GHG emissions in Canada, while providing flexibility for operators in locations where there may not be sufficient electricity system infrastructure. This is reflected in that units less than 25 MW currently account for approximately 2 percent of Canada’s electricity sector emissions. In addition, since efficiency decreases with MW sizing, units less than 25 MW are too inefficient to be a viable option for broad deployment of baseload power. |
| 2. Are connected to an electricity system that is subject to NERC standards | Avoids costs associated with units that: Generate mainly or solely for their own use, as these units are most often incorporated into larger industrial complexes that would be more appropriately regulated through instruments tailored to their industrial sector; and Are in remote or Northern locations, as these units are not expected to be a major source of GHG emissions in Canada and Northern locations do not have many options for low/non-emitting reliable electricity supplied at cost competitive locations. |
| Registration | Rationale |
| The proposed Regulations will require all units that meet the applicability criteria to register by the end of 2025 or, for units commissioned after January 1, 2025, within 60 days of commissioning. | The proposed Regulations require all units that may need to comply with the performance standard to register to demonstrate their awareness of their obligations and to provide the Department with the information necessary to conduct compliance promotion and enforcement activities prior to the performance standards applying. |
| Emission performance standards | Rationale |
A unit means an assembly comprised of any equipment that is physically connected and that operates together to generate electricity and
|
To maximize the emissions reductions achievable, the proposed Regulations would address power generation at the lowest level of production, which for the power sector is defined as ’a unit’. This approach aligns with that in the Reduction of Carbon Dioxide Emissions from Coal-fired Generation of Electricity Regulations and the Regulations Limiting Carbon Dioxide from Natural Gas-fired Generation of Electricity. |
| Units, other than those combusting coal, commissioned before January 1, 2025: Starting the latter of January 1, 2035, or 20 years after its commissioning, the proposed performance standard (30 t/GWh) would apply. | A phased in approach would allow existing units time to develop a compliance strategy and build/gain access to the needed infrastructure. By providing this flexibility, the reliability of the electricity system will be more easily maintained at current levels. This value aligns with the emissions intensity of natural gas generation with carbon capture and storage (CCS) achieving a 95% capture rate, which CCS experts and vendors have confirmed should be attainable by 2035. |
| Unit commissioned on or after January 1, 2025: Starting on January 1, 2035, the proposed performance standard would apply. | Providing new units 10 years to comply with the proposed Regulations offers flexibility. Operators will have sufficient time to undertake construction and obtain the materials needed for the provision of generating capacity sufficient to maintain reliability at current levels. |
| Unit that combusts coal or has increased its electricity generation capacity by at least 10 percent since its registration under the proposed Regulations: Starting on January 1, 2035, the proposed performance standard would apply. | The overarching purpose of the phased in approach is to help bridge the transition that comes about from the application of the performance standard. Units that are covered by the Reduction of Carbon Dioxide Emissions from Coal-fired Generation of Electricity Regulations, have already received such a phased in approach under those Regulations. Providing a second transition period would distort the emission reduction objectives of the proposed Regulations. |
A unit that ceased burning coal and has been "significantly modified": Starting on the latter of January 1, 2035, or January 1st of the year after its life extension under the Regulations Limiting Carbon Dioxide Emissions from Natural Gas-fired Generation of Electricity, the proposed performance standard would apply. For further information on the meaning of "significantly modified", refer to subsection 3(4) of the Regulations Limiting Carbon Dioxide Emissions from Natural Gas-fired Generation of Electricity. |
These significantly modified units are included in the Regulations Limiting Carbon Dioxide Emissions from Natural Gas-fired Generation of Electricity. There is an alignment between the Regulations to ensure the reliability of the electricity system. Significantly modified units have no pathway to operate without a performance standard past 2039. |
Only units that are net exporters in a given calendar year are subject to the performance standard in that year. Net exporters in this case applies to units that both generate power that is supplied to, and demand power from, a NERC-regulated electricity system. In this way, the proposed performance standard would only apply to those units that supply more power to a NERC-regulated electricity system than they demand. |
The proposed Regulations impose limits upon the CO2 associated with generation of electricity. The net export criterion is included here to distinguish between those facilities that are connected to an electricity system subject to NERC standards as a consumer versus those that are connected to an electricity system subject to NERC standards as a generator. The proposed Regulations require that the net exports are determined for each calendar year from which the prohibition would begin to apply to that unit. A unit with net exports in a calendar year will need to comply with the performance standard in that calendar year and in all subsequent years that it has net exports. These units would also be subject to quantification rules as of the first year with net exports once the prohibition would begin to apply to that unit. |
| Exceptions from meeting the general requirement to meet the 30 t/GWh performance standard | Rationale |
Mass-based emission/duration flexibility limiting low usage/low emitting units to 450 hr/yr and 150 kt/yr. This exception can be used where all applicable conditions are met in that calendar year. If all of the conditions related to this exception are not met in a given calendar year, then the 30 t/GWh annual average performance standard must be complied with in that year. |
Allows units, which are still capable of generating electricity, an emissions constrained role of adding value to the electricity system. For units which require this flexibility, the unit during periods of high demand or in which non-emitting sources are not available. In doing so, the flexibility reduces compliance costs and provides options for reserve power, thus helping to avoid reliability issues and upward pressures on affordability. |
40 t/GWh available until the earlier of seven years after commissioning of a carbon capture and storage (CCS) system or December 31, 2039. This exception can be used where all applicable conditions are met in that calendar year. If all of the conditions related to this exception are not met in a given calendar year, then the 30 t/GWh annual average performance standard must be complied with in that year. |
Allows units that have deployed CCS to meet the 30 t/GWh standard a limited time to adjust the CCS system and tailor its operation to the particularities of the unit. Allowing units that may not be able to meet the 30 t/GWh standard in their first seven years of operation to operate at the less stringent 40 t/GWh helps system operators provide reliable electricity. Furthermore to the above, tailoring is foreseen to be needed in the first generation of CCS applied to natural gas-fired generating units. The need for this exception will decrease over time and is anticipated to no longer be needed by 2040. Accordingly, limiting this flexibility supports the emission reduction objectives of the proposed Regulations. |
Emergency circumstances The proposed Regulations contain a provision that allows emitting electricity generation in order to avoid a threat to the electricity supply or to restore it. |
Allows for greater reliability of the electricity system, with benefits to improved quality of life and safety of Canadians. Additionally, this flexibility reduces costs, as it could allow units that would otherwise not be available in emergency circumstances to provide value in emergencies. |
| Quantification | Rationale |
| The measurement of the quantity of electricity generated during the course of a year, for use in determining compliance with the emission intensity performance standard, is to be measured on a gross basis. | This aligns with the approach taken under the Regulations Limiting Carbon Dioxide Emissions from Natural Gas-fired Generation of Electricity and recognizes quantification challenges for regulated units that have operations integrated with third parties not otherwise covered by the regulations. |
| For the amount of hydrogen fuel that a unit uses to produce electricity, the proposed Regulations would require emissions associated with that fuel’s production to be included in the determination of the unit’s emission intensity. | While there are no CO2 emissions from the combustion of hydrogen fuel, the emissions associated with its production are at least equal to the emissions from the combustion of fossil fuels in an electricity generating unit. Accordingly, the proposed Regulations would require the hydrogen fuel production emissions to be included in the determination of the unit’s emission intensity. |
| For the amount of steam produced outside a unit’s facility and which the unit uses to produce electricity, the proposed Regulations would require emissions associated with that steam production to be included in the determination of the unit’s emission intensity. | The emissions associated with the production of steam are at least equal to the emissions from the direct combustion of fossil fuels in an electricity generating unit. Accordingly, the proposed Regulations would require the steam production emissions to be included in the determination of the unit’s emission intensity. |
| Reporting | Rationale |
The proposed Regulations will require all units that meet the applicability criteria to submit a registration report that includes information such as:
|
This is to provide the Department with the information necessary to conduct compliance promotion and enforcement activities prior to the application of the performance standard. |
The proposed Regulations will require all units that have net exports to submit an annual report that includes information such as the unit’s:
|
This is to provide the Department with the information necessary to ensure compliance on an annual basis once the performance standard applies to that unit. |
| The proposed Regulations will require units that provide a declaration that they do not have net exports to annually submit information regarding their net exports. | Since the performance standard would have applied to these units if they had net exports, the Department requires that these units submit supporting documentation that shows that there are no net exports. All units must track their net exports as the performance standard will apply from the applicable year (as of 2035) for that unit if there are net exports in that year. |
PROPOSED REGULATORY TEXT
Notice is given, under subsection 332(1)footnote a of the Canadian Environmental Protection Act, 1999 footnote b, that the Governor in Council proposes to make the annexed Clean Electricity Regulations under subsections 93(1), section 286.1footnote c and subsection 330(3.2)footnote d of that Act.
Any person may, within 75 days after the date of publication of this notice, file with the Minister of the Environment comments with respect to the proposed Regulations or a notice of objection requesting that a board of review be established under section 333 of that Act and stating the reasons for the objection. Persons filing comments are strongly encouraged to use the online commenting feature that is available on the Canada Gazette website. Persons filing comments by any other means, and persons filing a notice of objection, should cite the Canada Gazette, Part I, and the date of publication of this notice, and send the comments or notice of objection to Karishma Boroowa, Director, Electricity and Combustion Division, Environment and Climate Change Canada, 351 Saint- Joseph Boulevard, Gatineau, Quebec, K1A 0H3 (email: ECD-DEC@ec.gc.ca).
Any person who provides information to the Minister may submit with the information a request for confidentiality under section 313 of that Act.
Ottawa, , 2023
Wendy Nixon
Assistant Clerk of the Privy Council
Clean Electricity Regulations
Purpose
Purpose
1 These Regulations establish a regime for limiting carbon dioxide (CO2) emissions that result from the generation of electricity from the combustion of fossil fuels.
Interpretation
Interpretation
2 (1) The following definitions apply in these Regulations.
- API
- means the American Petroleum Institute. (API)
- ASTM
- means ASTM International, formerly known as the American Society for Testing and Materials. (ASTM)
- auditor
- means an individual who
- (a) is independent of the responsible person that is to be audited; and
- (b) has knowledge of and has experience with respect to
- (i) the certification, operation and relative accuracy test audit of continuous emission monitoring systems, and
- (ii) quality assurance and quality control procedures in relation to those systems. (vérificateur)
- authorized official
- means
- (a) in respect of a responsible person that is a corporation, an officer of the corporation that is authorized to act on its behalf;
- (b) in respect of a responsible person that is an individual, that individual or an individual who is authorized to act on that individual’s behalf; and
- (c) in respect of a responsible person that is another entity, an individual authorized to act on that other entity’s behalf. (agent autorisé)
- biomass
- means plants or plant materials, animal waste or any product made of either of these, including wood and wood products, bio-charcoal, agricultural residues, biologically derived organic matter in municipal and industrial wastes, landfill gas, bio-alcohols, pulping liquor, sludge digestion gas and fuel from animal or plant origin. (biomasse)
- coal
- includes petroleum coke and synthetic gas that is derived from coal or petroleum coke. (charbon)
- coal gasification system
- includes a coal gasification system that is in part located underground. (système de gazéification du charbon)
- combustion engine
- means an engine, other than an engine that is self-propelled or designed to be propelled while performing its function, that
- (a) operates according to the Brayton thermodynamic cycle and combusts fossil fuel to produce a net amount of motive power; or
- (b) combusts fossil fuel and uses reciprocating motion to convert thermal energy into mechanical work. (moteur à combustion)
- commissioning date
- means the day on which the oldest boiler or combustion engine in the unit starts operating. (date de mise en service)
- continuous emission monitoring system or CEMS
- means equipment for the sampling, conditioning and analyzing of emissions from a given source and the recording of data related to those emissions. (système de mesure et d’enregistrement en continu des émissions ou SMECE)
- electricity generation capacity
- , in relation to a unit and a calendar year, means
- (a) the maximum continuous rating — the maximum net power than can be continuously sustained by the unit at standard conditions — of the unit, expressed in MW, as most recently reported to a provincial authority of competent jurisdiction or to the electric system operator in the province where the unit is located; or
- (b) if no report has been made, the most electricity that was produced for sale by the unit, expressed in MW, during two continuous hours in that calendar year. (capacité de production d’éléctricité)
- facility
- means units, buildings, other structures, stationary equipment — including equipment used for hydrogen fuel production and equipment used for fuel production from coal gasification — on a single site or on contiguous sites or adjacent sites that function as a single integrated site at which an industrial activity is carried out. (installation)
- fossil fuel
- means a fuel other than biomass. It includes hydrogen gas. (combustible fossile)
- GHGRP
- means the document entitled Canada’s Greenhouse Gas Quantification Requirements, Greenhouse Gas Reporting Program, published by the Department of the Environment in 2021. (méthode d’ECCC)
- NERC
- means the North American Electric Reliability Corporation. (NERC)
- net exports
- means for a given calendar year, the amount of electricity exported from a unit to an electricity system that is subject to NERC standards minus the amount of electricity imported to a unit from an electricity system that is subject to NERC standards, in GWh, measured using electricity meters that comply with the requirements of the Electricity and Gas Inspection Act and the Electricity and Gas Inspection Regulations. (solde exportateur)
- operator
- means a person who has the charge, management or control of a unit. (exploitant)
- Reference Method
- means the document entitled Reference Method for Source Testing: Quantification of Carbon Dioxide Releases by Continuous Emission Monitoring Systems from Thermal Power Generation, June 2012, published by the Department of the Environment. (méthode de référence)
- responsible person
- means an owner or operator of a unit. (personne responsable)
- standard conditions
- means a temperature of 15˚C and a pressure of 101.325 kPa. (conditions normales)
- unit
- means an assembly comprised of any equipment that is physically connected and that operates together to generate electricity, and
- (a) must include at least a boiler or combustion engine, and
- (b) may include duct burners and other combustion devices, heat recovery systems, steam turbines, generators, emission control devices and carbon capture and storage systems. (groupe)
- useful thermal energy
- means energy in the form of steam or hot water that is destined for a use, other than the generation of electricity, that would have required the consumption of energy in the form of fuel or electricity had that steam or hot water not been used. (énergie thermique utile)
More than one owner or operator
(2) For the purposes of the definition of facility, if there is more than one owner or operator for the facility, those elements are only included in the definition of facility if there is at least one owner or operator in common.
Carbon capture and storage
(3) Equipment that is connected only by a carbon capture and storage system is not considered physically connected for the purposes of the definition of unit in subsection (1). That carbon capture and storage system must be included in the description of each unit connected to it.
Interpretation of documents incorporated by reference
(4) For the purposes of interpreting documents that are incorporated by reference into these Regulations, “should” is to be read as “must” and any recommendation or suggestion is to be read as an obligation.
Incorporation by reference
(5) Unless otherwise indicated, a reference to any document incorporated by reference into these Regulations, except the GHGRP, is incorporated as amended from time to time.
Application
Specified units
3 These Regulations apply to a unit that, on or after January 1, 2025, meets the following criteria:
- (a) has an electricity generation capacity of 25 MW or more;
- (b) generates electricity using fossil fuel; and
- (c) is connected to an electricity system that is subject to NERC standards.
Registration
Registration Report
4 (1) A responsible person must register the unit by submitting a registration report to the Minister that contains the information set out in Schedule 1
- (a) in the case of a unit that has a commissioning date on or after January 1, 2025, within 60 days after the date on which the unit was commissioned; or
- (b) in the case of all other units, by December 31, 2025.
Modification
(2) If a unit is modified, such as by adding or removing a piece of equipment or changing how equipment is physically connected, and that modification creates one or more new units, the responsible person must
- (a) register any new unit by submitting a registration report to the Minister that contains the information set out in Schedule 1 within 30 days after the date on which the unit was created; and
- (b) notify the Minister that either the original unit has ceased to generate electricity, in accordance with subsection 24(3), or has been modified, in accordance with section 25.
Registration number
(3) On receipt of the registration report, the Minister must assign a registration number to the unit and inform the responsible person of that registration number.
Net Exports Declaration
Declaration
5 (1) A responsible person may submit to the Minister a declaration, dated and signed by the responsible person or their authorized official, stating that net exports with respect to their unit are less than or equal to 0 GWh and containing the following information:
- (a) the unit’s registration number, assigned by the Minister under subsection 4(3); and
- (b) an attestation that the declaration is accurate and complete.
December 31
(2) The declaration must be submitted to the Minister on or before December 31 of the calendar year prior to the calendar year in which the prohibition set out in subsection 6(1) will apply to that unit.
Exemptions
(3) If a declaration has been submitted with respect to a unit, the responsible person is exempt from sections 6 to 24.
Short report
(4) A responsible person for a unit with respect to which a declaration has been submitted must submit a short report to the Minister, containing the information set out in sections 1 and 2 of Schedule 2 and the net exports for that unit for the calendar year, on or before the June 1 that follows the calendar year that is the subject of the report.
Exemption ends
(5) Subject to subsection (6), the exemptions in subsection (3) do not apply with respect to the unit if the unit has net exports that are greater than 0 GWh in any calendar year.
Emergency exemption
(6) If a unit has net exports that are greater than 0 GWh in a calendar year due to the quantity of electricity being exported from the unit during a period for which the Minister has issued an exemption for that unit under section 19 or an extension under section 20, the exemptions set out in subsection (3) will continue to apply.
Prohibition
Prohibition
6 (1) A responsible person, for a unit with respect to which net exports are greater than 0 GWh during a calendar year, must not emit CO2 from the unit, from the combustion of fossil fuel, that has on average during that calendar year an emission intensity of more than 30 tonnes of CO2 emissions/GWh of electricity generated, determined in accordance with sections 7 to 18, as applicable.
Exception — carbon capture and storage
(2) Despite subsection (1), a responsible person, for a unit with respect to which net exports are greater than 0 GWh, may, until December 31, 2039, emit from the unit CO2 from the combustion of fossil fuel that has, on average during the calendar year, an emission intensity no more than 40 tonnes of CO2 emissions/GWh of electricity generated, determined in accordance with sections 7 to 18, as applicable, if
- (a) the unit includes a carbon capture and storage system that started operating within the last seven calendar years; and
- (b) the responsible person for that unit has submitted, with the annual report, documentation demonstrating that the unit operated at or below 30 tonnes of CO2 emissions/GWh for two periods of at least 12 continuous hours, with at least four months between those two periods, in the calendar year for which the annual report is submitted.
Exception — hours
(3) Despite subsection (1), a responsible person may, for a unit that has not combusted coal during the calendar year and with respect to which net exports are greater than 0 GWh, emit from that unit up to 150 kilotonnes of CO2 in a calendar year, determined in accordance with section 8, if the unit operates for 450 hours or less during that calendar year, not including any hours the unit operates and CO2 the unit emits during a period for which the Minister has issued an exemption under section 19 or an extension under section 20.
Start of prohibition
(4) The responsible person for a unit must meet the emission intensity limit set out in subsection (1), beginning
- (a) January 1, 2035, with respect to a unit that
- (i) has a commissioning date on or after January 1, 2025,
- (ii) has increased its electricity generation capacity by 10% or more since submitting the registration report for the unit, or
- (iii) combusts coal;
- (b) in the case of a boiler unit referred to in subsection 3(4) of the Regulations Limiting Carbon Dioxide Emissions from Natural Gas-fired Generation of Electricity, the later of
- (i) January 1 of the calendar year the prohibition set out in subsection 4(2) of those Regulations begins to apply to the unit, as determined under that subsection; or
- (ii) January 1, 2035, or
- (c) January 1 of the calendar year following the unit’s end of prescribed life, with respect to all other units.
Definition — prescribed life
(5) For the purposes of paragraph (4)(c), prescribed life means the period that begins on the commissioning date and ends on the later of
- (a) December 31 of the calendar year that is 20 years after the commissioning date, and
- (b) December 31, 2034.
Quantification
Emission Intensity
Emission intensity
7 (1) The emission intensity of a unit is determined by the formula
- E ÷ G
- where
- E
- is the quantity of CO2 emissions attributed to a unit, during the calendar year, expressed in tonnes, determined in accordance with section 8; and
- G
- is the quantity of electricity generated by the unit during the calendar year, expressed in GWh, determined in accordance with subsection 18(1).
Negative number
(2) For the purposes of the formula in subsection (1), 0 should be used for the element E if the determination under section 8 results in a negative number.
Quantity of CO2 Emissions
Quantification Methods
Quantification of emissions
8 (1) The quantity of CO2 emissions attributed to a unit during the calendar year is determined by the formula
- Eu − Eth − Eccs + Eext − Eec
- where
- Eu
- is the quantity of CO2 emissions, expressed in tonnes, during the calendar year from the combustion of fossil fuel in the unit, as determined in accordance with subsection (3) and, as applicable, section 9, 10 or 13;
- Eth
- is the quantity of CO2 emissions, expressed in tonnes, attributable to the production of useful thermal energy by the unit, during the calendar year, calculated in accordance with section 15;
- Eccs
- is the quantity of CO2 captured from the unit during the calendar year and stored in a storage project, expressed in tonnes, determined in accordance with section 16;
- Eext
- is the quantity of CO2 emitted from the production of the hydrogen fuel or the purchased or transferred steam used by the unit to generate electricity, during the calendar year, expressed in tonnes, determined in accordance with section 17; and
- Eec
- is the quantity of CO2 emitted from the unit during any period in the calendar year for which the Minister has issued an exemption under section 19 or an extension under section 20, expressed in tonnes, determined in accordance with subsection (2).
Calculation of Eec
(2) The element Eec is the difference between the sum of Eu and Eext and the sum of Eth and Eccs calculated in accordance with sections 9, 10, 13, 15 to 17 and 19, as applicable, but the reference to calendar year is replaced with the period during the calendar year for which the Minister has issued an exemption under section 19 or an extension under section 20.
Quantification method for Eu
(3) The quantity of CO2 emissions resulting from the combustion of fossil fuel in a unit in a calendar year (Eu) must be determined in accordance with
- (a) section 9, in the case of a unit that combusted fuel from a coal gasification system during the calendar year;
- (b) section 10, in the case of a unit that combusted biomass and combusted fuel from a coal gasification system during the calendar year;
- (c) section 13, in the case of a unit that combusted biomass, but did not combust fuel from a coal gasification system, during the calendar year; and
- (d) section 9 or 13, in any other case.
Carbon capture and storage
(4) For the purposes of the element Eccs in subsections (1) and (2), the quantity of CO2 may only be included in that description if it has been permanently stored in a storage project that meets the following criteria:
- (a) the geological site into which the CO2 is injected is
- (i) a deep saline aquifer for the sole purpose of storage of CO2, or
- (ii) a depleted oil reservoir for the purpose of enhanced oil recovery; and
- (b) the CO2 stored for the purposes of the project is captured, transported and stored in accordance with the laws applicable to Canada or a province or applicable to the United States or one of its states.
Continuous Emission Monitoring System
Quantification with CEMS
9 Subject to section 11, for the purposes of paragraph 8(3)(a), the quantity of CO2 emissions must be measured using a CEMS and determined in accordance with Sections 7.1 to 7.7 of the Reference Method. This also applies with respect to a responsible person that, in accordance with paragraph 8(3)(d), opts to quantify emissions in accordance with this section.
Unit combusting biomass
10 (1) Subject to section 11, for the purposes of paragraph 8(3)(b), the quantity of CO2 emissions must be quantified using a CEMS and must be determined by the formula
- Ecomb × (Vff ÷ VT) − Es
- where
- Ecomb
- is the quantity of CO2 emissions from the unit, expressed in tonnes, during the calendar year from the combustion of fossil fuel and biomass, as measured by the CEMS, and calculated in accordance with Sections 7.1 to 7.7 of the Reference Method;
- Vff
- is the volume of CO2 emissions released from the combustion of fossil fuel in the unit during the calendar year, expressed in m3, at standard conditions, and determined by the formula
- VT
- is the volume of CO2 emissions released from combustion of fossil fuel and biomass in the unit during the calendar year determined by the formula
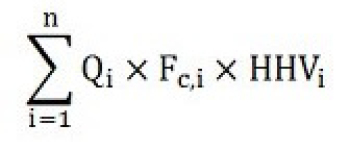
- where
- i
- is the ith fossil fuel type combusted in the unit during the calendar year, where “i” goes from 1 to n and where n is the number of fossil fuels so combusted,
- Qi
- is the quantity of fossil fuel type “i” combusted in the unit during the calendar year, determined
- (a) for a gaseous fuel, in the same manner used in the determination of Vf in the formula set out in paragraph 14(1)(a) and expressed in m3 at standard conditions,
- (b) for a liquid fuel, in the same manner used in the determination of Vf in the formula set out in paragraph 14(1)(b) and expressed in kL, and
- (c) for a solid fuel, in the same manner used in the determination of Mf in the formula set out in paragraph 14(1)(c) and expressed in tonnes,
- Fc,i
- is the fuel-specific carbon-based F-factor for each fossil fuel type “i” — either the factor set out in Appendix A of the Reference Method, or for fuels not listed, the one determined in accordance with that Appendix — corrected to be expressed in m3, at standard conditions, of CO2/GJ, and
- HHVi
- is the higher heating value for each fossil fuel type “i” that is measured in accordance with subsection (2), or the default higher heating value, set out in column 2 of Schedule 3, for the fuel type, as set out in column 1;
- VT
- is the volume of CO2 emissions released from combustion of fossil fuel and biomass in the unit during the calendar year determined by the formula
-
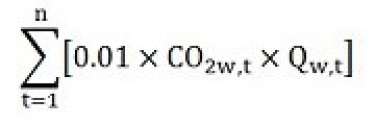
- where
- t
- is the tth hour, where “t” goes from 1 to n and where n is the total number of hours during which the unit generated electricity in the calendar year,
- CO2w,t
- is the average concentration of CO2 in relation to all gases in the stack emitted from the combustion of fuel in the unit during each hour “t”, during which the unit generated electricity in the calendar year — or, if applicable, a calculation made in accordance with Section 7.4 of the Reference Method of that average concentration of CO2 based on a measurement of the concentration of oxygen (O2) in those gases in the stack — expressed as a percentage on a wet basis, and
- Qw,t
- is the average volumetric flow during that hour, measured on a wet basis by the stack gas volumetric flow monitor, expressed in m3, at standard conditions; and
-
- Es
- is the quantity of CO2 emissions, expressed in tonnes, that is released from the use of sorbent to control the emission of sulphur dioxide from the unit during the calendar year, determined by the formula
- S × R × (44 ÷ MMs)
- where
- S
- is the quantity of sorbent material, such as calcium carbonate (CaCO3), expressed in tonnes,
- R
- is the stoichiometric ratio, on a mole fraction basis, of CO2 released on usage of one mole of sorbent material, which is equal to 1 if the sorbent material is CaCO3, and
- MMs
- is the molecular mass of the sorbent material, which is equal to 100 if the sorbent material is CaCO3.
Higher heating value
(2) The higher heating value of a fuel is to be measured
- (a) for a gaseous fuel,
- (i) in accordance with the following standards, as applicable
- (A) ASTM D1826-94(2017), entitled Standard Test Method for Calorific (Heating) Value of Gases in Natural Gas Range by Continuous Recording Calorimeter,
- (B) ASTM D3588-98(2017), entitled Standard Practice for Calculating Heat Value, Compressibility Factor, and Relative Density of Gaseous Fuels,
- (C) ASTM D4891-13, entitled Standard Test Method for Heating Value of Gases in Natural Gas and Flare Gases Range by Stoichiometric Combustion,
- (D) Gas Processors Association Standard 2172 - 14, entitled Calculation of Gross Heating Value, Relative Density, Compressibility and Theoretical Hydrocarbon Liquid Content for Natural Gas Mixtures for Custody Transfer, and
- (E) Gas Processors Association Standard 2261 - 13, entitled Analysis for Natural Gas and Similar Gaseous Mixtures by Gas Chromatography, or
- (ii) by means of a direct measuring device that measures the higher heating value of the fuel, but if the measuring device provides only lower heating values, those lower heating values must be converted to higher heating values; and
- (i) in accordance with the following standards, as applicable
- (b) for a liquid fuel that is
- (i) an oil or a liquid fuel derived from waste, in accordance with
- (A) ASTM D240-17, entitled Standard Test Method for Heat of Combustion of Liquid Hydrocarbon Fuels by Bomb Calorimeter, or
- (B) ASTM D4809-13, entitled Standard Test Method for Heat of Combustion of Liquid Hydrocarbon Fuels by Bomb Calorimeter (Precision Method), and
- (ii) any other liquid fuel type, in accordance with an applicable ASTM standard for the measurement of the higher heating value of the fuel type or, if no such ASTM standard applies, in accordance with an applicable internationally recognized method.
- (i) an oil or a liquid fuel derived from waste, in accordance with
Multiple CEMS per unit
11 (1) For the purposes of sections 9 and 10, the total quantity of CO2 emissions from a unit equipped with multiple CEMS is determined by adding together the quantity of CO2 emissions measured for each CEMS.
Units sharing common stack
(2) If a unit is located at a facility where there is one or more other units and a CEMS measures emissions from that unit and other units at a common stack rather than at the exhaust duct of that unit and of each of those other units that brings those emissions to the common stack, then the quantity of emissions attributable to that unit is determined based on the ratio of the heat input of that unit to the total of the heat input of that unit and of all of those other units sharing the common stack in accordance with the formula
-
- where
- Qu,j
- is the quantity of fuel type “j” combusted in that unit “u” during the calendar year, determined
- (a) for a gaseous fuel, in the same manner as the one used in the determination of Vf in the formula set out in paragraph 14(1)(a) and expressed in m3 at standard conditions,
- (b) for a liquid fuel, in the same manner as the one used in the determination of Vf in the formula set out in paragraph 14(1)(b) and expressed in kL, and
- (c) for a solid fuel, in the same manner as the one used in the determination of Mf in the formula set out in paragraph 14(1)(c) and expressed in tonnes;
- HHVu,j
- is the higher heating value for each fossil fuel type “j” that is combusted in that unit “u” that is measured in accordance with subsection 10(2), or the default higher heating value, set out in column 2 of Schedule 3, for the fuel type, as set out in column 1;
- j
- is the jth fuel type combusted during the calendar year in a unit where “j” goes from 1 to y and where y is the number of those fuel types;
- Qi,j
- the quantity of fuel type “j” combusted in each unit “i” during the calendar year, determined for a gaseous fuel, a liquid fuel and a solid fuel, respectively, in the manner set out in the description of Qu,j;
- HHVi,j
- is the higher heating value for each fossil fuel type “j” that is combusted in that unit “i” that is measured in accordance with subsection 10(2), or the default higher heating value, set out in column 2 of Schedule 3, for the fuel type, as set out in column 1;
- i
- is the ith unit, where “i” goes from 1 to x, and where x is the number of units that share a common stack; and
- E
- is the quantity of CO2 emissions, expressed in tonnes, from the combustion of all fuels in all the units that share a common stack during the calendar year, measured by a CEMS at the common stack, and calculated in accordance with Sections 7.1 to 7.7 of the Reference Method.
If using CEMS
12 (1) If a CEMS is being used to measure CO2 emissions, the responsible person must ensure that the requirements set out in the Reference Method are met.
Certification of CEMS
(2) The responsible person must certify the CEMS in accordance with Section 5 of the Reference Method, before it is used for the purposes of these Regulations.
Auditor’s report
(3) For each calendar year during which the responsible person used a CEMS, they must obtain a report, signed by the auditor, that contains the information required by Schedule 4 and submit that report to the Minister with the annual report referred to in subsection 24(1).
Fuel-based Method
Quantification
13 The quantity of CO2 emissions resulting from the combustion of fossil fuels in a unit in a calendar year is determined by the formula
-

- where
- i
- is the ith fossil fuel type that is combusted in the calendar year in a unit, where “i” goes from 1 to n and where n is the number of those fossil fuel types;
- Ei
- is the quantity of CO2 emissions that is attributable to the combustion of fossil fuels of type “i” in the unit in the calendar year, expressed in tonnes, as determined for that fuel type in accordance with section 14; and
- Es
- is the quantity of CO2 emissions that is released from the sorbent used to control the emission of sulphur dioxide from the unit in the calendar year, expressed in tonnes, as determined by the formula
- S × R × (44 ÷ MMs)
- where
- S
- is the quantity of sorbent material, such as calcium carbonate (CaCO3), expressed in tonnes,
- R
- is the stoichiometric ratio, on a mole fraction basis, of CO2 released on usage of 1 mole of sorbent material, which is equal to 1 if the sorbent material is CaCO3, and
- MMs
- is the molecular mass of the sorbent material, which is equal to 100 if the sorbent material is CaCO3.
Measured carbon content
14 (1) The quantity of CO2 emissions that is attributable to the combustion of a fossil fuel in a unit in a calendar year is determined by one of the following formulas, as applicable
- (a) for a gaseous fuel,
- Vf × CCA × (MMA ÷ MVcf) × 3.664 × 0.001
- where
- Vf
- is the volume of the fuel combusted in the calendar year, determined using flow meters, expressed in m3, at standard conditions,
- CCA
- is the weighted average of the carbon content of the fuel, determined in accordance with subsection (2), expressed in kg of carbon per kg of the fuel,
- MMA
- is the average molecular mass of the fuel, determined based on fuel samples taken in accordance with section 21, expressed in kg per kg-mole of the fuel, and
- MVcf
- is the molar volume conversion factor of 23.645 m3, at standard conditions, per kg-mole of the fuel at standard conditions;
- (b) for a liquid fuel,
- Vf × CCA × 3.664
- where
- Vf
- is the volume of the fuel combusted in the calendar year, determined using flow meters, expressed in kL, and
- CCA
- is the weighted average of the carbon content of the fuel, determined in accordance with subsection (2), at the same temperature as that used in the determination of Vf, expressed in tonnes of carbon per kL of the fuel; and
- (c) for a solid fuel,
- Mf × CCA × 3.664
- where
- Mf
- is the mass of the fuel combusted in the calendar year, determined, as the case may be, on a wet or dry basis using a measuring device, expressed in tonnes, and
- CCA
- is the weighted average of the carbon content of the fuel, determined in accordance with subsection (2), on the same wet or dry basis as that used in the determination of Mf, expressed in kg of carbon per kg of the fuel.
Weighted average
(2) The weighted average “CCA” referred to in paragraphs (1)(a) to (c) is determined by the formula
- where
- CCi
- is the carbon content of each sample or composite sample, as the case may be, of the fuel for the ith sampling period, expressed for gaseous fuels, liquid fuels and solid fuels, respectively, in the same unit of measure as that set out in CCA, as provided by the supplier of the fuel to the responsible person or, if not so provided, as determined by the responsible person in the following manner:
- (a) for a gaseous fuel,
- (i) in accordance with the following standards for the measurement of the carbon content of the fuel, as applicable
- (A) ASTM D1945-14, entitled Standard Test Method for Analysis of Natural Gas by Gas Chromatography,
- (B) ASTM UOP539-12, entitled Refinery Gas Analysis by Gas Chromatography,
- (C) ASTM D7833-14, entitled Standard Test Method for Determination of Hydrocarbons and Non-Hydrocarbon Gases in Gaseous Mixtures by Gas Chromatography, and
- (D) API Technical Report 2572, 1st edition, published in May 2013 and entitled Carbon Content, Sampling, and Calculation, or
- (ii) by means of a direct measuring device that measures the carbon content of the fuel,
- (i) in accordance with the following standards for the measurement of the carbon content of the fuel, as applicable
- (b) for a liquid fuel, in accordance with the following standards or methods for the measurement of the carbon content of the fuel, as applicable
- (i) API Technical Report 2572, 1st edition, published in May 2013 and entitled Carbon Content, Sampling, and Calculation,
- (ii) ASTM D5291-16, entitled Standard Test Methods for Instrumental Determination of Carbon, Hydrogen, and Nitrogen in Petroleum Products and Lubricants,
- (iii) the ASTM standard that applies to the type of fuel, or
- (iv) if no ASTM standard applies, an applicable internationally recognized method, and
- (c) for a solid fuel, on the same wet or dry basis as that used in the determination of CCA, in accordance with,
- (i) for a solid fuel derived from waste, ASTM E777-08, entitled Standard Test Method for Carbon and Hydrogen in the Analysis Sample of Refuse-Derived Fuel, and
- (ii) for any other solid fuel, the following standard or method for the measurement of the carbon content of the fuel, as applicable:
- (A) the ASTM standard that applies to the type of fuel, and
- (B) if no ASTM standard applies, an applicable internationally recognized method;
- (a) for a gaseous fuel,
- i
- is the ith sampling period that is referred to in section 21, where “i” goes from 1 to n and where n is the number of those sampling periods; and
- Qi
- is the volume or mass, as the case may be, of the fuel combusted during the ith sampling period, expressed
- (a) in m3, at standard conditions, for a gaseous fuel,
- (b) in kL for a liquid fuel, and
- (c) in tonnes for a solid fuel, on the same wet or dry basis as that used in the determination of CCA.
Useful Thermal Energy
Emissions – useful thermal energy (Eth)
15 The quantity of CO2 emitted by the unit attributable to the production of useful thermal energy by the unit is determined by the formula
- Hpnet × bEI
- where
- Hpnet
- is the net useful thermal energy, expressed in GJ, determined by the formula:
-
- where
- t
- is the tth hour, where “t” goes from 1 to x and where x is the total number of hours during which the unit produced useful thermal energy in the calendar year,
- i
- is the ith heat stream exiting the unit, where “i” goes from 1 to n and where n is the total number of heat streams exiting the unit,
- hout_i
- is the average specific enthalpy of the ith heat stream exiting the unit, expressed in GJ/tonne, during period “t” and must be based on the measurement of the temperature and pressure of that heat stream and determined using a continuous measuring device,
- Mout_i
- is the mass flow of the ith heat stream exiting the unit, expressed in tonnes, during period “t”, determined using a continuous measuring device,
- j
- is the jth heat stream, other than condensate return, entering the unit, where “j” goes from 1 to m and where m is the total number of heat streams entering the unit,
- hin_j
- is the average specific enthalpy of the jth heat stream, other than condensate return, entering the unit, expressed in GJ/tonne, during period “t” and must be based on the measurement of the temperature and pressure of that heat stream and determined using a continuous measuring device,
- Min_j
- is the mass flow of the jth heat stream, other than condensate return, entering the unit, expressed in tonnes, during period “t” and determined using a continuous measuring device; and
- bEI
- is the emission intensity of a reference boiler, set to 0.0556 tonnes of CO2/GJ.
-
Carbon Capture and Storage
Emissions captured and stored (Eccs)
16 The quantity of CO2 that is captured from the unit during the calendar year and stored in a storage project is determined by the formula
- Eu × (Ecap ÷ Ein)
- where
- Eu
- is the value of Eu in subsection 8(1);
- Ecap
- is the quantity of CO2 emissions that is the portion of Ein that has been captured and subsequently stored, during the calendar year, in a storage project that meets the criteria set out in subsection 8(4), expressed in tonnes, determined by means of direct measuring devices that measure the flow of, and the concentration of CO2 in, those emissions; and
- Ein
- is the quantity of CO2 emissions, expressed in tonnes, entering the carbon capture and storage system during the calendar year, determined using a CEMS, in accordance with Sections 7.1 to 7.7 of the Reference Method, that measures upstream of the carbon capture and storage system and that measures all emissions entering the carbon capture and storage system.
Hydrogen Fuel and Steam
Quantification of emissions (Eext)
17 (1) The quantity of CO2 emitted from the production of the hydrogen fuel or steam used by the unit to generate electricity is determined by the formula
- where
- Ek
- is the total annual CO2 emissions that result from the total annual production of hydrogen fuel or from the total annual production of steam, expressed in tonnes, in the calendar year;
- Pk
- is the total annual production of the hydrogen fuel, expressed in m3 at standard conditions, or steam, expressed in GJ, in a calendar year, determined using a continuous measuring device;
- Qk
- is the quantity of hydrogen, expressed in m3 at standard conditions, or purchased or transferred steam, expressed in GJ, used by the unit to generate electricity, during the calendar year, determined using a continuous measuring device; and
- k
- is the kth stream of hydrogen or steam, with “k” going from 1 to n, where n is the number of streams of hydrogen or steam that are used by the unit during the calendar year.
Quantification of Ek and Pk
(2) The responsible person must, if possible, obtain the quantity of Ek and Pk from the supplier of the hydrogen fuel or steam, quantified in accordance with section 10 of the GHGRP with respect to hydrogen production and with section 7 of the GHGRP with respect to electricity and heat production.
Variable RCO2
(3) For the purposes of subsection (2), the description of the element RCO2 in Equation 10-2 of the GHGRP must be read as “CO2 captured and permanently stored in a storage project that meets the criteria set out in paragraphs 8(4)(a) and (b) of these Regulations”.
Default value
(4) Despite subsection (2), the responsible person must replace the ratio Ek÷Pk in the formula set out in subsection (1), with 0.08 tonnes of CO2/GJ for both hydrogen and steam if
- (a) the production of hydrogen fuel does not occur at the facility at which the unit is located or the steam is purchased or transferred to the facility at which the unit is located; and
- (b) the responsible person is not able to get the information required to determine Ek or Pk from the supplier of the hydrogen fuel or steam.
Quantity of Electricity
Quantity of electricity
18 (1) The quantity of electricity generated by the unit is determined by the formula
- Ggross − Gec
- where
- Ggross
- is the gross quantity of electricity generated by the unit in the calendar year, expressed in GWh, measured at the electrical terminals of the generators of the unit using a meter that has received an approval referred to in subsection 9(4) of the Electricity and Gas Inspection Act; and
- Gec
- is the gross quantity of electricity generated by the unit during any period during the calendar year for which the Minister has issued an exemption under section 19 or an extension under section 20, expressed in GWh, measured at the electrical terminals of the generators of the unit using a meter that has received an approval referred to in subsection 9(4) of the Electricity and Gas Inspection Act.
Meter specifications
(2) The meters referred to in subsection (1) must be installed and used in accordance with the most current electricity specification relating to design, composition, construction and performance of the class, type or design of that meter referred to in subsection 12(1) of the Electricity and Gas Inspection Regulations, published on the Measurement Canada website as an electricity specification.
Emergency Circumstances
Application for exemption
19 (1) A responsible person, under an emergency circumstance described in subsection (2), may apply to the Minister for an exemption from subsections 6(1) to (3) in respect of a unit if, as a result of the emergency, the operator of the electricity system in the province in which the unit is located or an official of that province responsible for ensuring and supervising the electricity supply orders the responsible person to produce electricity to avoid a threat to the supply or to restore that supply.
Definition of emergency circumstance
(2) An emergency circumstance is a circumstance
- (a) that arises due to an extraordinary, unforeseen and irresistible event; or
- (b) under which one or more of the measures referred to in paragraph 1(a) of the Regulations Prescribing Circumstances for Granting Waivers Pursuant to Section 147 of the Act has been made or issued in the province where the unit is located.
Application — deadline and content
(3) The application for the exemption must be provided to the Minister within 15 days after the day on which the emergency circumstance arises. The application must include the information referred to in section 1 and paragraphs 2(a) to (d) of Schedule 1 or the unit’s registration number, the date on which the emergency circumstance arose and information, along with supporting documents, to demonstrate that the conditions set out in subsection (1) of this section are met.
Minister’s decision
(4) If the Minister is satisfied that the conditions set out in subsection (1) are met, the Minister must, within 30 days after the day on which the application is received, grant the exemption.
Duration of exemption
(5) The exemption becomes effective on the day on which the emergency circumstance arises and ceases to have effect on the earliest of
- (a) the 90th day after that day,
- (b) the day specified by the Minister,
- (c) the day on which the circumstance referred to in paragraph (2)(a) ceases to cause a disruption, or a significant risk of disruption, to the electricity supply in the province where the unit is located, and
- (d) the day on which the measure, if any, referred to in paragraph (2)(b) ceases to have effect.
Application for extension of exemption
20 (1) If the conditions set out in subsection 19(1) will continue to exist after the day on which the exemption granted under paragraph 19(4) is to cease to have effect, the responsible person may, before that day, apply to the Minister for an extension of the exemption.
Contents of application
(2) The application must include
- (a) the unit’s registration number, assigned by the Minister, if applicable;
- (b) the day on which the emergency circumstance began; and
- (c) information, along with supporting documents that demonstrate that the conditions set out in subsection 19(1) will continue to exist after the day on which the exemption is to cease to have effect.
Minister’s decision
(3) If the Minister is satisfied that the condition referred to in paragraph (2)(c) has been demonstrated, the Minister must grant the extension within 15 days after the day on which the application is received.
Duration of extension
(4) The extension ceases to have effect on the earliest of
- (a) the 90th day after the day on which the application for the extension was made,
- (b) the day specified by the Minister, and
- (c) the day referred to in paragraph 19(5)(c).
Sampling and Missing Data
Sampling
21 (1) The determination of the value of the elements referred to in a formula in section 14 must be based on fuel samples taken in accordance with this section.
Carbon content provided by the supplier
(2) If the supplier of the fuel has provided the carbon content of the fuel and that carbon content has been determined in accordance with subsection 14(2), using the applicable sampling period and minimum sampling frequency set out in subsection (3), the responsible person may use that information rather than taking samples in accordance with subsection (3).
Frequency
(3) Each fuel sample must be taken at a time and location in the fuel handling system of the facility that provides the following representative samples of the fuel combusted at the applicable minimum frequency:
- (a) for natural gas, during each sampling period consisting of each year that the unit generates electricity or produces useful thermal energy, two samples taken that year, with each of those samples being taken at least four months after any previous sample has been taken, in accordance with whichever of the following standard that applies:
- (i) ASTM D4057-12, entitled Standard Practice for Manual Sampling of Petroleum and Petroleum Products,
- (ii) ASTM D4177-16e1, entitled Standard Practice for Automatic Sampling of Petroleum and Petroleum Products,
- (iii) ASTM D5287-08(2015), entitled Standard Practice for Automatic Sampling of Gaseous Fuels, and
- (iv) ASTM F307-13, entitled Standard Practice for Sampling Pressurized Gas for Gas Analysis;
- (b) for refinery gas, during each sampling period consisting of each day that the unit generates electricity or produces useful thermal energy, one sample per day that is taken at least six hours after any previous sample has been taken, in accordance with any applicable standard referred to in paragraph (a);
- (c) for a type of liquid fuel or of a gaseous fuel other than refinery gas and natural gas, during each sampling period consisting of each month that the unit generates electricity or produces useful thermal energy, one sample per month that is taken at least two weeks after any previous sample has been taken, in accordance with any of the standards referred to in paragraph (a); and
- (d) for a solid fuel, one composite sample per month that consists of sub-samples, each having the same mass, that are taken from the fuel that is fed for combustion during each week that begins in that month and during which the unit generates electricity or produces useful thermal energy, and after all fuel treatment operations have been carried out but before any mixing of the fuel from which the sub-sample is taken with other fuels, and at least 72 hours after any previous sub-sample has been taken.
Additional samples
(4) Despite subsection (3), if the responsible person takes more samples or composite samples, as the case may be, than the minimum required and a determination is made on the carbon content of any of those samples or composite samples, using a method set out for CCi in subsection 14(2) for that fuel type, the results of those determinations must be included in the determination of CCA set out in subsection 14(2).
Missing data
22 (1) If, for any reason beyond the responsible person’s control, any element of any formula in the Regulations cannot be determined because data required to determine it is missing for a given period in a calendar year, replacement data for that given period must be used to determine that value.
Replacement data — CEMS
(2) If a CEMS is used to determine the value of an element of a formula set out in sections 9 to 11 but data is missing for a given period, the replacement data must be obtained in accordance with Section 3.5.2 of the Reference Method.
Replacement data — non-CEMS
(3) If data, other than data referred to in subsection (2), required to determine the value of any element of a formula in these Regulations is missing for a given period, the replacement data is to be the average of the available data for that element during the equivalent period prior to and, if the data is available, subsequent to that given period. However, if no data is available for that element for the equivalent period prior to that given period, the replacement data to be used is the value determined for that element during the equivalent period subsequent to the given period.
Replacement data — maximum days
(4) During a calendar year, there may be more than one given period, but replacement data may be used for a maximum of 28 days during the calendar year, distributed among any or all of those periods.
Accuracy of Data
Measuring devices — installation, maintenance and calibration
23 (1) A responsible person must install, maintain and calibrate a measuring device, other than a continuous emission monitoring system and a measuring device that is subject to the Electricity and Gas Inspection Act, that is used for the purposes of these Regulations in accordance with the manufacturer’s instructions or any applicable generally recognized national or international industry standard.
Frequency of calibration
(2) The responsible person must calibrate each of the measuring devices at the following frequencies:
- (a) at least once in every calendar year but at least five months after a previous calibration; or
- (b) the minimum frequency recommended by the manufacturer.
Accuracy of measurements
(3) The responsible person must use measuring devices that enable measurements to be made with a degree of accuracy of ±5%.
Reporting
Annual reports
24 (1) Subject to subsection (3), beginning in the calendar year during which section 6 applies to the responsible person, that responsible person must submit an annual report with respect to the unit containing the information referred to in Schedule 2 for each calendar year the unit meets the criteria set out in section 3 of these Regulations.
June 1
(2) The responsible person must submit the annual report on or before June 1 of the calendar year that follows the calendar year that is the subject of the report.
Permanent cessation
(3) If a unit permanently ceases to generate electricity in a calendar year, the responsible person for the unit must submit to the Minister a notice, in writing, not later than 60 days after the day on which the unit ceases generating electricity, containing the information set out in Schedule 5. An annual report is not required to be submitted in respect of the calendar years following the calendar year in which the unit ceases generating electricity.
Change of information
25 If there is a change to any information submitted to the Minister in the registration report, the responsible person must notify the Minister of the change and provide the new information, in writing, not later than 60 days after the day on which the change is made.
Correcting error
26 A responsible person must, without delay, notify the Minister, in writing, of any error in the information in a report submitted in accordance with these Regulations and provide the corrected information.
Signature and submission — electronic
27 (1) A report or notice that is required, or an application that is made, under these Regulations must be submitted electronically in the form specified by the Minister and must bear the electronic signature of the responsible person or their authorized official.
Paper report, notice and application
(2) If the Minister has not specified an electronic form or if the person is unable to submit the report, notice or application electronically in accordance with subsection (1) because of circumstances beyond the person’s control, the report, notice or application must be sent on paper, in the form specified by the Minister, if applicable, and be signed by the responsible person or their authorized official.
Records
Record
28 (1) A responsible person must make a record containing the following documents and information:
- (a) any notice, declaration, application, attestation, report or information submitted to the Minister under these Regulations, along with supporting documents;
- (b) measurements and calculations used to determine the value of an element of any formula set out in sections 7, 8, 10, 11 and 13 to 18, as applicable, along with an indication of the standards or methods that were used to determine the value of the elements used in those formulas, along with supporting documents;
- (c) an indication of the standards or methods referred to in the description of CCi in subsection 14(1) for a sample of gaseous fuel, including a statement that indicates that a direct measuring device was used to determine that value;
- (d) information demonstrating that an electricity meter referred to in section 18 complies with the requirements of the Electricity and Gas Inspection Act and the Electricity and Gas Inspection Regulations, including a certificate referred to in section 14 of that Act;
- (e) the manufacturer’s instructions for any measuring device used to determine any value or quantity in any section of these Regulations;
- (f) information demonstrating that the requirements set out in section 23 are met;
- (g) supporting documents that confirm the CEMS certification under subsection 12(2);
- (h) any document, record or information referred to in Section 8 of the Reference Method, for each calendar year during which a responsible person used a CEMS;
- (i) the results of the analysis of every sample taken in accordance with section 21, as well as the date that each sample was taken and an indication of the standards that were used to take representative samples of the fuel;
- (j) if the supplier of hydrogen or steam has provided the quantity of Ek or Pk under subsection 17(2), the information provided by the supplier;
- (k) if the supplier of fuel has provided the carbon content of that fuel under subsection 21(2), the information provided by the supplier;
- (l) information demonstrating electricity generation capacity submitted in the registration report and each annual report; and
- (m) if replacement data was used under section 22, information with respect to the reason replacement data was required, along with the replacement data that was used.
Time limit
(2) The records must be made as soon as feasible but not later than 30 days after the day on which the information and documents to be included in it become available.
Retention of records, reports and notices
29 (1) A responsible person that is required under these Regulations to make a record or send a report or notice must keep the record or a copy of the report or notice, along with the supporting documents
- (a) until the responsible person has submitted a notice of permanent cessation under subsection 24(3), with respect to documentation set out in Schedule 1; or
- (b) for a period of seven years after the later of when the record is made or a report or notice is submitted to the Minister.
Location of records
(2) A record or copy must be kept at the responsible person’s principal place of business in Canada or at any other place in Canada where it can be inspected. If the record or copy is kept at any of those other places, the responsible person must provide the Minister with a civic address of that other place.
Relocation of records
(3) If the records are moved, the responsible person must notify the Minister, in writing, of the civic address in Canada of the new location within 30 days after the day of the move.
Language of Documents
Language of documents
30 All documents required by these Regulations must be in English or French, or be accompanied by a translation in English or French and an affidavit of the translator attesting to the accuracy of the translation.
Consequential Amendment to the Regulations Designating Regulatory Provisions for Purposes of Enforcement (Canadian Environmental Protection Act, 1999)
| Item | Column 1 Regulations |
Column 2 Provisions |
|---|---|---|
| 42 | Clean Electricity Regulations |
|
Repeals
32 The Reduction of Carbon Dioxide Emissions from Coal-fired Generation of Electricity Regulations footnote 51 is repealed.
33 The Regulations Limiting Carbon Dioxide Emissions from Natural Gas-fired Generation of Electricity footnote 52 is repealed.
Coming into Force
January 1, 2025
34 (1) These Regulations, except sections 32 and 33, come into force on January 1, 2025.
January 1, 2035
(2) Section 32 comes into force on January 1, 2035.
January 1, 2045
(3) Section 33 comes into force on January 1, 2045.
SCHEDULE 1
(Subsection 4(1), paragraph 4(2)(a), subsection 19(3), and paragraph 29(1)(a))
Registration Report — Information Required
1 The following information respecting the responsible person:
- (a) an indication of whether they are the owner or operator of the unit and their name and civic address;
- (b) the name, title, civic and postal addresses, telephone number and, if any, email address and fax number of their authorized official; and
- (c) the name, title, civic and postal addresses, telephone number and, if any, email address and fax number of a contact person, if different from the authorized official.
2 The following information respecting the unit:
- (a) for each responsible person for the unit, other than the responsible person referred to in paragraph 1(a), if any,
- (i) their name and civic address,
- (ii) an indication of whether they are an owner or operator, and
- (iii) in the case of an owner, their percentage of ownership interest;
- (b) its name and civic address, if any;
- (c) if applicable, its National Pollutant Release Inventory identification number assigned by the Minister for the purpose of section 48 of the Canadian Environmental Protection Act, 1999;
- (d) the year, determined in accordance with section 6(4) of these Regulations, in which it must meet the intensity limit;
- (e) its commissioning date;
- (f) the date each piece of equipment that comprises it started operating;
- (g) the date on which the carbon capture and storage system equipment started operating, if applicable;
- (h) its electricity generation capacity;
- (i) its registration number, if any, assigned by the Minister under subsection 4(2) of the Reduction of Carbon Dioxide Emissions from Coal-fired Generation of Electricity Regulations;
- (j) the unit’s registration number, if any, assigned by the Minister under subsection 21(4) of the Regulations Limiting Carbon Dioxide Emissions from Natural Gas-fired Generation of Electricity;
- (k) a process diagram of the unit that indicates, if applicable,
- (i) major equipment, including boilers, combustion engines, duct burners and other combustion devices, heat recovery systems, steam turbines, generators and emission control devices and carbon capture and storage system equipment,
- (ii) how the equipment referred to in subparagraph (i) is physically connected and operates together,
- (iii) the unit boundaries used to identify the unit,
- (iv) the electric flows crossing the unit boundaries, and
- (v) if applicable, the heat streams crossing the unit boundaries and their average temperature, pressure and hourly mass flow rate; and
- (l) if the unit contains a combustion engine, boiler or steam turbine that was previously contained in another unit registered under these Regulations,
- (i) the registration number of the previous unit,
- (ii) the electricity generation capacity of the combustion engine, that is part of the combustion equipment, or steam turbine, as applicable, and
- (iii) the date on which the combustion engine, boiler or steam turbine started operating in the unit that is the subject of the report.
SCHEDULE 2
(Subsections 5(4) and 24(1))
Annual Report — Information Required
1 The unit’s registration number, assigned by the Minister under subsection 4(3) of these Regulations.
2 The following information for the calendar year:
- (a) the number of hours during which the unit produced electricity; and
- (b) with respect to a unit for which the Minister has issued an exemption under section 19 or an extension under section 20 of these Regulations,
- (i) the period for which the exemption or extension was issued,
- (ii) the number of hours during the period referred to in subparagraph (i) during which the unit operated.
3 The following information respecting the emission intensity referred to in section 7 of these Regulations:
- (a) the emission intensity for the unit, expressed in tonnes of CO2 per GWh;
- (b) in respect of the quantity of CO2 emissions from the combustion of fuels in the unit (Eu), if that quantity is
- (i) determined in accordance with section 9, 10 or 11 of these Regulations, the quantity determined in accordance with the applicable section, expressed in tonnes, and
- (ii) determined in accordance with section 13 of these Regulations,
- (A) the quantity determined in accordance with that section, expressed in tonnes,
- (B) the quantity of CO2 emissions attributable to the combustion of a fossil fuel for each fossil fuel type (Ei), determined in accordance with section 14 of these Regulations, expressed in tonnes, and
- (C) the quantity of CO2 emissions that is released from the sorbent (Es), for each fossil fuel type, expressed in tonnes;
- (c) for each type of fuel combusted in the unit
- (i) the type, and if that type is biomass, an explanation of how that it meets the definition biomass in subsection 2(1) of these Regulations, and
- (ii) the quantity of fuel combusted;
- (d) in respect of the quantity of electricity generated by the unit,
- (i) that quantity determined in accordance with subsection 18(1) of these Regulations, expressed in GWh, and
- (ii) the values determined for Ggross and Gec in the formula set out in subsection 18(1) of these Regulations, expressed in GWh; and
- (e) the weighted average of the carbon content of the fuel (CCA), determined in accordance with subsection 14(2) of these Regulations, for each fuel combusted, along with an indication of which ASTM standard or method, including using a direct measuring device, was used for each calculation.
4 The following information with respect to the unit:
- (a) the values determined for Eth, Eccs, Eext and Eec, in the formula set out in section 8 of these Regulations, expressed in tonnes;
- (b) the values determined for Hpnet, hout_i, Mout_i, hin_j and Min_j used to determine Eth in accordance with section 15 of these Regulations, expressed in GJ, tonnes, or GJ/tonne, as applicable;
- (c) the values determined for Ecap and Ein, used to determine Eccs in accordance with section 16 of these Regulations, expressed in tonnes;
- (d) the values determined for Ek, Pk and Qk, used to determine Eext in accordance with section 17 of these Regulations, expressed in tonnes or GJ, as applicable;
- (e) the values referred to in section 3 of this Schedule for any calculation done in accordance with subsection 8(2) of these Regulations;
- (f) the result of the formula in subsection 18(1) of these Regulations, expressed in GWh;
- (g) the value determined for Ggross in the formula set out in subsection 18(1) of these Regulations, expressed in GWh;
- (h) the value determined for Gec in the formula set out in subsection 18(1) of these Regulations, expressed in GWh; and
- (i) its net exports, expressed in GWh, during the previous calendar year.
5 With respect to a unit for which the Minister has issued an exemption under section 19 or an extension under section 20 of these Regulations, the duration of the emergency circumstance, including the date on which the circumstance arose and the date on which it ceased.
6 With respect to a unit referred to in subsection 6(2) of these Regulations,
- (a) the year in which the carbon capture and storage system started operating and documents establishing that the captured CO2 was captured, transported and stored in accordance with the requirements of subsection 8(4) of these Regulations, and
- (b) documentation demonstrating that the unit operated at or below 30 tonnes/GWh for two periods of at least 12 continuous hours, with at least four months between those two periods, in the calendar year for which the annual report is submitted.
7 With respect to a unit referred to in subsection 6(3) of these Regulations, a statement that an exemption referred to in that subsection is being used for the calendar year.
8 If applicable, a copy of the auditor’s report referred to in subsection 12(3) of these Regulations.
9 The following information respecting the replacement data referred to in section 22 of these Regulations that was used for a given period during the calendar year, if applicable:
- (a) the reason why data required to determine the value of an element of a formula referred to in these Regulations was not obtained and how that reason was beyond the responsible person’s control;
- (b) the element of the formula for which data was not obtained and the date of the day on which the data was not obtained and, if that data was not obtained for a period of several days, the dates of the days on which the period begins and ends; and
- (c) the value determined for the element referred to in paragraph (b) using replacement data, along with details of that determination, including
- (i) the data used to make that determination for each period of one or more days,
- (ii) the method used to obtain that replacement data, and
- (iii) in the case of a determination of the value of an element referred to in subsection 22(3) of these Regulations, a justification for the given period being used as the basis of that determination.
SCHEDULE 3
(Subsections 10(1) and 11(2))
| Item | Column 1 Fuel type |
Column 2 Default higher heating value |
Column 3 Units |
|---|---|---|---|
| 1 | Distillate fuel oil No. 1 | 38.78 | GJ/kL |
| 2 | Distillate fuel oil No. 2 | 38.50 | GJ/kL |
| 3 | Distillate fuel oil No. 4 | 40.73 | GJ/kL |
| 4 | Kerosene | 37.68 | GJ/kL |
| 5 | Liquefied petroleum gases (LPG) | 25.66 | GJ/kL |
| 6 | Propane table g2 note 1 | 25.31 | GJ/kL |
| 7 | Propylene | 25.39 | GJ/kL |
| 8 | Ethane | 17.22 | GJ/kL |
| 9 | Ethylene | 27.90 | GJ/kL |
| 10 | Isobutane | 27.06 | GJ/kL |
| 11 | Isobutylene | 28.73 | GJ/kL |
| 12 | Butane | 28.44 | GJ/kL |
| 13 | Butylene | 28.73 | GJ/kL |
| 14 | Natural gasoline | 30.69 | GJ/kL |
| 15 | Motor gasoline | 34.87 | GJ/kL |
| 16 | Aviation gasoline | 33.52 | GJ/kL |
| 17 | Kerosene-type aviation | 37.66 | GJ/kL |
| 18 | Pipeline quality natural gas | 0.03793 | GJ/m3 at standard conditions |
| 19 | Bituminous Canadian coal — Western | 25.6 | GJ/tonne |
| 20 | Bituminous Canadian coal — Eastern | 27.9 | GJ/tonne |
| 21 | Bituminous non-Canadian coal — U.S. | 25.7 | GJ/tonne |
| 22 | Bituminous non-Canadian coal — other countries | 29.9 | GJ/tonne |
| 23 | Sub-bituminous Canadian coal — Western | 19.2 | GJ/tonne |
| 24 | Sub-bituminous non-Canadian coal — U.S. | 19.2 | GJ/tonne |
| 25 | Coal — lignite | 15.0 | GJ/tonne |
| 26 | Coal — anthracite | 27.7 | GJ/tonne |
| 27 | Coal coke and metallurgical coke | 28.8 | GJ/tonne |
| 28 | Petroleum coke from refineries | 46.4 | GJ/tonne |
| 29 | Petroleum coke from upgraders | 40.6 | GJ/tonne |
| 30 | Municipal solid waste | 11.5 | GJ/tonne |
| 31 | Tires | 31.2 | GJ/tonne |
| 32 | Diesel | 38.3 | GJ/kL |
| 33 | Light fuel oil | 38.8 | GJ/kL |
| 34 | Heavy fuel oil | 42.5 | GJ/kL |
| 35 | Ethanol | 21 | GJ/kL |
| 36 | Hydrogen | 0.012289 | GJ/m3 at standard conditions |
Table g2 note(s)
|
|||
SCHEDULE 4
(Subsection 12(3))
CEMS Auditor’s Report — Information Required
1 The unit’s registration number, assigned by the Minister under subsection 4(3) of these Regulations.
2 The name, civic address and telephone number of the responsible person.
3 The name, civic address, telephone number and qualifications of the auditor and, if any, the auditor’s email address and fax number.
4 The procedures followed by the auditor to assess whether
- (a) the responsible person’s use of the CEMS complied with the Quality Assurance/Quality Control manual referred to in Section 6.1 of the Reference Method; and
- (b) the responsible person complied with the Reference Method and the CEMS met the specifications set out in the Reference Method, in particular, in its Sections 3 and 4.
5 A statement of the auditor’s opinion as to whether
- (a) the responsible person’s use of the CEMS complied with the Quality Assurance/Quality Control manual referred to in Section 6.1 of the Reference Method; and
- (b) the responsible person complied with the Reference Method and the CEMS met the specifications set out in the Reference Method, in particular, in its Sections 3 and 4.
6 A statement of the auditor’s opinion as to whether the responsible person has ensured that the Quality Assurance/Quality Control manual has been updated in accordance with Sections 6.1 and 6.5.2 of the Reference Method.
SCHEDULE 5
(subsection 24(3))
Permanent Cessation of Electricity Generation Report
1 The unit’s registration number, assigned by the Minister under subsection 4(3) of these Regulations.
2 An attestation dated and signed by the responsible person or their authorized official that the unit has permanently ceased generating electricity.
3 The date on which the unit permanently ceased generating electricity.
Terms of use and Privacy notice
Terms of use
It is your responsibility to ensure that the comments you provide do not:
- contain personal information
- contain protected or classified information of the Government of Canada
- express or incite discrimination on the basis of race, sex, religion, sexual orientation or against any other group protected under the Canadian Human Rights Act or the Canadian Charter of Rights and Freedoms
- contain hateful, defamatory, or obscene language
- contain threatening, violent, intimidating or harassing language
- contain language contrary to any federal, provincial or territorial laws of Canada
- constitute impersonation, advertising or spam
- encourage or incite any criminal activity
- contain external links
- contain a language other than English or French
- otherwise violate this notice
The federal institution managing the proposed regulatory change retains the right to review and remove personal information, hate speech, or other information deemed inappropriate for public posting as listed above.
Confidential Business Information should only be posted in the specific Confidential Business Information text box. In general, Confidential Business Information includes information that (i) is not publicly available, (ii) is treated in a confidential manner by the person to whose business the information relates, and (iii) has actual or potential economic value to the person or their competitors because it is not publicly available and whose disclosure would result in financial loss to the person or a material gain to their competitors. Comments that you provide in the Confidential Business Information section that satisfy this description will not be made publicly available. The federal institution managing the proposed regulatory change retains the right to post the comment publicly if it is not deemed to be Confidential Business Information.
Your comments will be posted on the Canada Gazette website for public review. However, you have the right to submit your comments anonymously. If you choose to remain anonymous, your comments will be made public and attributed to an anonymous individual. No other information about you will be made publicly available.
Comments will remain posted on the Canada Gazette website for at least 10 years.
Please note that public email is not secure, if the attachment you wish to send contains sensitive information, please contact the departmental email to discuss ways in which you can transmit sensitive information.
Privacy notice
The information you provide is collected under the authority of the Financial Administration Act, the Department of Public Works and Government Services Act, the Canada–United States–Mexico Agreement Implementation Act,and applicable regulators’ enabling statutes for the purpose of collecting comments related to the proposed regulatory changes. Your comments and documents are collected for the purpose of increasing transparency in the regulatory process and making Government more accessible to Canadians.
Personal information submitted is collected, used, disclosed, retained, and protected from unauthorized persons and/or agencies pursuant to the provisions of the Privacy Act and the Privacy Regulations. Individual names that are submitted will not be posted online but will be kept for contact if needed. The names of organizations that submit comments will be posted online.
Submitted information, including personal information, will be accessible to Public Services and Procurement Canada, who is responsible for the Canada Gazette webpage, and the federal institution managing the proposed regulatory change.
You have the right of access to and correction of your personal information. To seek access or correction of your personal information, contact the Access to Information and Privacy (ATIP) Office of the federal institution managing the proposed regulatory change.
You have the right to file a complaint to the Privacy Commission of Canada regarding any federal institution’s handling of your personal information.
The personal information provided is included in Personal Information Bank PSU 938 Outreach Activities. Individuals requesting access to their personal information under the Privacy Act should submit their request to the appropriate regulator with sufficient information for that federal institution to retrieve their personal information. For individuals who choose to submit comments anonymously, requests for their information may not be reasonably retrievable by the government institution.