
Vol. 146, No. 19 — September 12, 2012
Registration
SOR/2012-167 August 30, 2012
CANADIAN ENVIRONMENTAL PROTECTION ACT, 1999
Reduction of Carbon Dioxide Emissions from Coal-fired Generation of Electricity Regulations
P.C. 2012-1060 August 30, 2012
Whereas, pursuant to subsection 332(1) (see footnote a) of the Canadian Environmental Protection Act, 1999 (see footnote b), the Minister of the Environment published in the Canada Gazette, Part Ⅰ, on August 27, 2011, a copy of the proposed Reduction of Carbon Dioxide Emissions from Coal-fired Generation of Electricity Regulations, substantially in the annexed form, and persons were given an opportunity to file comments with respect to the proposed Regulations or to file a notice of objection requesting that a board of review be established and stating the reasons for the objection;
Whereas, pursuant to subsection 93(3) of that Act, the National Advisory Committee has been given an opportunity to provide its advice under section 6 (see footnote c) of that Act;
And whereas, in accordance with subsection 93(4) of that Act, the Governor in Council is of the opinion that the proposed Regulations do not regulate an aspect of a substance that is regulated by or under any other Act of Parliament in a manner that provides, in the opinion of the Governor in Council, sufficient protection to the environment and human health;
Therefore, His Excellency the Governor General in Council, on the recommendation of the Minister of the Environment and the Minister of Health, pursuant to subsections 93(1)and 330(3.2) (see footnote d) of the Canadian Environmental Protection Act, 1999 (see footnote e), makes the annexed Reduction of Carbon Dioxide Emissions from Coal-fired Generation of Electricity Regulations.
TABLE OF CONTENTS
(This table is not part of the Regulations.)
REDUCTION OF CARBON DIOXIDE EMISSIONS FROM COAL-FIRED GENERATION OF ELECTRICITY REGULATIONS
OVERVIEW
1 Purpose
INTERPRETATION
2 Definitions
PART 1
REGULATED UNITS AND EMISSION LIMIT
EMISSION-INTENSITY LIMIT
3 Limit — 420t/GWh
REGISTRATION
4 Registration
SUBSTITUTION OF UNITS AND DEFERRED APPLICATION
5 Application of subsection 3(1) — substituted units
6 Deferral of application of subsection 3(1)
EMERGENCY CIRCUMSTANCES
7 Conditions for application
8 Extension
CARBON CAPTURE AND STORAGE
Temporary Exemption — System to be Constructed
9 Application
10 Requirements
11 Implementation report
12 Updated information
13 Revocation — non-satisfaction or misleading information
Twenty-four Month Exemption — Existing Unit with System
14 Exemption
PART 2
REPORTING, SENDING, RECORDING AND RETENTION OF INFORMATION
15 Annual report
16 Electronic report, notice and application
17 Record-making
18 Retention of records and reports
PART 3
QUANTIFICATION RULES
PRODUCTION OF ELECTRICITY
19 Electricity
CO2 EMISSIONS
Means of Quantification
20 CEMS or fuel-based methods
Continuous Emissions Monitoring System
21 Quantification
Fuel-based Methods
22 Determination
23 Measured carbon content
24 Quantification based on HHV
ACCURACY OF DATA
25 Measuring devices — installation, maintenance and calibration
26 CEMS
FUEL SAMPLING AND TESTING REQUIREMENTS
27 Fuel sampling
28 Missing Data
PART 4
COMING INTO FORCE
29 July 1, 2015
SCHEDULE 1
SCHEDULE 2
SCHEDULE 3
SCHEDULE 4
SCHEDULE 5
SCHEDULE 6
REDUCTION OF CARBON DIOXIDE EMISSIONS FROM COAL-FIRED GENERATION OF ELECTRICITY REGULATIONS
OVERVIEW
Purpose
1. (1) These Regulations establish a regime for the reduction of carbon dioxide (CO2) emissions that result from the production of electricity by means of thermal energy using coal as a fuel, whether in conjunction with other fuels or not.
Contents
(2) These Regulations are divided into four Parts as follows:
- (a) Part 1 sets out a performance standard for the intensity of CO2 emissions from regulated units and provides for exceptions based on the substitution of units and for temporary exemptions in relation to emergencies and units integrated with carbon capture and storage systems;
- (b) Part 2 sets out requirements for the reporting, sending, recording and retention of information;
- (c) Part 3 sets out quantification rules for determining the intensity of CO2 emissions from regulated units; and
- (d) Part 4 provides dates for the coming into force of these Regulations and, in particular, delays the coming into force of the performance standard in respect of standby units until January 1, 2030.
INTERPRETATION
Definitions
2. (1) The following definitions apply in these Regulations.
“Act”
« Loi »
“Act” means the Canadian Environmental Protection Act, 1999.
“ASTM”
« ASTM »
“ASTM” means ASTM International, formerly known as the American Society for Testing and Materials.
“auditor”
« vérificateur »
“auditor” means a person who
- (a) is independent of the responsible person who is to be audited; and
- (b) has demonstrated knowledge of and experience in
- (i) the certification, operation and relative accuracy test audit (RATA) of continuous emission monitoring systems, and
- (ii) quality assurance and quality control procedures in relation to those systems.
- (i) the certification, operation and relative accuracy test audit (RATA) of continuous emission monitoring systems, and
“authorized official”
« agent autorisé »
“authorized official” means
- (a) in respect of a responsible person that is a corporation, an officer of the corporation who is authorized to act on its behalf;
- (b) in respect of a responsible person that is an individual, that person or a person authorized to act on that individual’s behalf; and
- (c) in respect of a responsible person that is another entity, a person authorized to act on that other entity’s behalf.
“biomass”
« biomasse »
“biomass” means a fuel that consists only of non-fossilized, biodegradable organic material that originates from plants or animals but does not come from a geological formation, and includes gases and liquids recovered from organic waste.
“calendar year”
« année civile »
“calendar year” means
- (a) for 2015, the period of six consecutive months that begins on July 1, 2015; and
- (b) in any other case, the period of 12 consecutive months that begins on January 1.
“capacity factor”
« facteur de capacité »
“capacity factor”, in respect of a unit in a calendar year, means the ratio of the quantity of electricity referred to in section 19 that is produced by the unit to the quantity of electricity that would be produced by the unit in the calendar year if it were to operate at its production capacity at all times during the calendar year.
“coal”
« charbon »
“coal” includes petroleum coke and synthetic gas that is derived from coal or petroleum coke.
“commissioning date”
« date de mise en service »
“commissioning date” means
- (a) for an electricity generator that began producing electricity by means of thermal energy using a fuel other than coal, and not in conjunction with coal, but that was converted into a unit before June 23, 2010, the day on which that generator began to produce electricity for sale to the electric grid using fuel other than coal, and not in conjunction with coal; and
- (b) in any other case, the day on which a unit begins to produce electricity for sale to the electric grid.
“existing unit”
« groupe existant »
“existing unit” means a unit that is neither an old unit nor a new unit.
“fossil fuel”
« combustible fossile »
“fossil fuel” means a fuel other than biomass.
“front end engineering design study”
« étude d’ingénierie d’avant-projet détaillé »
“front end engineering design study” means a collection of studies that provide the necessary details to support the carrying out of a construction project for the capture element of a carbon capture and storage system, including
- (a) technical drawings and documents that describe the capture element in sufficient detail to permit the tendering of a contract for its construction;
- (b) an estimation of the capital cost of the capture element with a margin of error of ± 20%;
- (c) a safety review of the capture element;
- (d) a risk assessment of the carbon capture and storage system, namely an assessment of the risks that may delay or prevent the completion of the construction of the system, including technical, economic, environmental, legal and labour-related risks;
- (e) a strategy to mitigate those risks; and
- (f) a detailed plan to carry out the construction of the carbon capture and storage system, including a schedule for the completion of its major steps.
“gasification system”
« système de gazéification »
“gasification system” includes a gasification system that is in part located underground.
“GPA”
« GPA »
“GPA” means the Gas Processors Association of the United States.
“major equipment”
« équipement majeur »
“major equipment” means a boiler, gasifier, shift reactor, turbine, air pollution control device, air separation unit, compressor, CO2 separation system or other equipment that
- (a) is manufactured in accordance with specifications in its purchase order and takes more than 12 months after the date of the purchase order to be manufactured and delivered; or
- (b) costs $10,000,000 or more.
“new unit”
« groupe nouveau »
“new unit” means a unit, other than an old unit, whose commissioning date is on or after July 1, 2015.
“old unit”
« groupe en fin de vie utile »
“old unit” means a unit that has reached the end of its useful life but continues to produce electricity.
“operator”
« exploitant »
“operator” means the person that operates or has the charge, management or control of a unit.
“power plant”
« centrale électrique »
“power plant” means all units, buildings and other structures and all stationary equipment — including equipment for the separation and initial pressurization of CO2 of the capture element of a carbon capture and storage system — on a single site, or on adjacent sites that function as a single integrated site, whose primary purpose is the production of electricity for sale to the electric grid.
“production capacity”
« capacité de production »
“production capacity”, in relation to a unit and a calendar year, means
- (a) the maximum continuous rating of the unit, expressed in MW, as most recently reported to a provincial authority of competent jurisdiction or to the electric system operator in the province where the unit is located; or
- (b) if no report has been made, the most electricity that was produced for sale by the unit, expressed in MW, during two continuous hours in that calendar year.
“Reference Method”
« Méthode de référence »
“Reference Method” means the document entitled Reference Method for Source Testing: Quantification of Carbon Dioxide Releases by Continuous Emission Monitoring Systems from Thermal Power Generation, June 2012, published by the Department of the Environment.
“responsible person”
« personne responsable »
“responsible person” means an owner or operator of a unit.
“standard m3”
« m3 normalisé »
“standard m3” has the meaning assigned to a cubic metre at standard pressure and standard temperature by the definition “standard volume” in subsection 2(1) of the Electricity and Gas Inspection Regulations.
“standby unit”
« groupe de réserve »
“standby unit” means an old unit that, for a given calendar year, operates at a capacity factor of 9% or less.
“unit”
« groupe »
“unit” means physically connected equipment located in a power plant — including boilers and other combustion devices, gasifiers, reactors, turbines, generators and emission control devices — that operates together to produce electricity by means of thermal energy using coal as a fuel, whether in conjunction with other fuels or not.
“useful life”
« vie utile »
“useful life”, in respect of a unit, means the period that begins on the commissioning date and ends on
- (a) for a unit other than a unit referred to in paragraph (a) of the definition “commissioning date”,
- (i) in the case of a unit whose commissioning date is before 1975, the earlier of
- (A) December 31 of the calendar year that is 50 years after the commissioning date, and
- (B) December 31, 2019; and
- (A) December 31 of the calendar year that is 50 years after the commissioning date, and
- (ii) in the case of a unit whose commissioning date is after 1974 but before 1986, the earlier of
- (A) December 31 of the calendar year that is 50 years after the commissioning date, and
- (B) December 31, 2029, and
- (A) December 31 of the calendar year that is 50 years after the commissioning date, and
- (iii) in any other case, December 31 of the calendar year that is 50 years after the commissioning date, and
- (i) in the case of a unit whose commissioning date is before 1975, the earlier of
- (b) for a unit referred to in paragraph (a) of the definition “commissioning date”, 18 months after the applicable date described in subparagraph (a)(i), (ii) or (iii).
Interpretation of incorporated documents
(2) For the purposes of interpreting documents incorporated by reference into these Regulations, “should” must be read to mean “must” and any recommendation or suggestion must be read as an obligation.
Standards incorporated by reference
(3) Any standard of the ASTM or GPA that is incorporated by reference into these Regulations is incorporated as amended from time to time.
PART 1
REGULATED UNITS AND EMISSION LIMIT
EMISSION-INTENSITY LIMIT
Limit — 420t/GWh
3. (1) A responsible person for a new unit or an old unit must not, on average, emit with an intensity of more than 420 tonnes CO2 emissions from the combustion of fossil fuels in the unit for each GWh of electricity produced by the unit during a calendar year.
Quantification of electricity and emissions
(2) The quantity of
- (a) electricity referred to in subsection (1) is to be determined in accordance with section 19; and
- (b) emissions referred to in subsection (1) are to be determined in accordance with the applicable provisions of sections 20 to 24.
CO2 released from sorbent
(3) The CO2 emissions released from the use of sorbent to control the emission of sulphur dioxide from a unit are to be included as CO2 emissions from the combustion of fossil fuels in that unit for the purpose of subsection (1).
Coal gasification systems
(4) Emissions from a gasification system that produces synthetic gas derived from coal or petroleum coke that is used as a fuel to produce electricity from a unit referred to in subsection (1) are to be included as emissions from that unit, for the purpose of subsection (1), if that coal gasification system has at least one responsible person in common with that unit.
CCS excluded
(5) The CO2 emissions from a unit referred to in subsection (1) do not include emissions that are captured in accordance with the laws of Canada or a province that regulate that capture and that are transported and stored in accordance with the laws of Canada or a province, or of the United States or one of its states, that regulate that transportation or storage, as the case may be.
Partial year application
(6) For greater certainty, if subsection (1) applies in respect of a unit only for a period during a calendar year, that period is considered to be the calendar year for the purpose of that subsection.
REGISTRATION
Registration
4. (1) A responsible person for a unit must register the unit by sending to the Minister a registration report that contains the information set out in Schedule 1
- (a) for an existing unit and an old unit, on or before February 1, 2013; and
- (b) for a new unit, on or before 30 days after its commissioning date.
Registration number
(2) On receipt of the registration report, the Minister must assign a registration number to the unit and inform the responsible person of that registration number.
Change of information
(3) If the information provided in the registration report changes, the responsible person must send a notice to the Minister that provides the updated information not later than 30 days after the change.
SUBSTITUTION OF UNITS AND DEFERRED APPLICATION
Application of subsection 3(1) — substituted units
5. (1) For the purpose of subsection 3(1), a responsible person for a unit (referred to in this section as the “original unit”) that reaches the end of its useful life during a calendar year may apply to the Minister to have another unit (referred to in this section as the “substituted unit”) substituted for the original unit if the following conditions are satisfied:
- (a) the substituted unit is an existing unit;
- (b) the original unit and the substituted unit have a common owner who has an ownership interest of 50% or more in each of those two units;
- (c) those two units are located in the same province; and
- (d) the production capacity of the substituted unit, during the calendar year preceding the calendar year in which the application is made, was equal to or greater than the production capacity of the original unit during that preceding calendar year.
Period of application
(2) The application must be made
- (a) if the original unit reaches the end of its useful life during a calendar year before 2015, in the period that begins on January 1, 2014 and that ends on May 31, 2014; and
- (b) if the original unit reaches the end of its useful life during a calendar year after 2014, in the period that begins on January 1 and that ends on May 31 of that calendar year.
Content of application
(3) The application must include the registration number of the original unit and of the substituted unit and information, with supporting documentation, to demonstrate that the conditions of paragraphs (1)(b) to (d) are satisfied.
Granting of substitution
(4) The Minister must, within 30 days after receiving the application, grant the substitution if the following conditions are satisfied:
- (a) the substituted unit is not a shut-down unit referred to in subsection 6(4);
- (b) the substituted unit is not involved in an exemption granted under subsection 14(4); and
- (c) the Minister is satisfied that the conditions of paragraphs (1)(a) to (d) are satisfied.
Effect
(5) On the granting of the substitution, subsection 3(1) applies in respect of the substituted unit rather than the original unit as of the later of
- (a) July 1, 2015, and
- (b) the beginning of the calendar year that follows the calendar year in which the application is made.
Cessation of effect
(6) The substitution referred to in subsection (5) ceases to have effect, and subsection 3(1) applies in respect of the original unit, as of the earliest of
- (a) the calendar year that follows the day on which the responsible person for that unit and the substituted unit sends the Minister a notice indicating that they wish the substitution to no longer have an effect,
- (b) the calendar year that follows the day on which the condition of paragraph (1)(b) is no longer satisfied,
- (c) the calendar year that follows a calendar year during which the production capacity of the original unit was more than the production capacity of the substituted unit referred to in paragraph (1)(d),
- (d) the calendar year that follows the end of the useful life of the substituted unit, and
- (e) a calendar year during which electricity is produced by the substituted unit by means of thermal energy using fossil fuel other than coal, and not in conjunction with coal.
Deferral of application of subsection 3(1)
6. (1) A responsible person for an existing unit that ceases to produce electricity after June 30, 2015 (referred to in this section as the “shut-down unit”) may apply to the Minister to have the application of subsection 3(1) deferred in respect of another unit or units (referred to in this section as the “deferred units”) for the number of years in the period that begins on January 1 of the calendar year that follows that cessation and that ends on December 31 of the calendar year in which the useful life of the shut-down unit ends. If the application is granted, the application of subsection 3(1) is, in respect of each calendar year in that period, deferred for the deferred unit and the calendar year that begins after the end of that deferred unit’s useful life that the responsible person specifies in their application.
Conditions of application for deferral
(2) The application may be made only if the following conditions are satisfied:
- (a) the shut-down unit and each of the specified deferred units have a common owner who has an ownership interest of 50% or more in the shut-down unit and in each of those specified deferred units;
- (b) the shut-down unit and each of those specified deferred units are located in the same province; and
- (c) the production capacity of the shut-down unit, during the calendar year preceding the day on which it ceased production, was greater than or equal to the production capacity of each of those specified deferred units during the calendar year preceding the day on which the application was made.
Content of application
(3) The application must be made on or before May 31 of the calendar year preceding the earliest of the specified calendar years referred to in subsection (1) and must
- (a) indicate the calendar years included in the period referred to in subsection (1);
- (b) specify the deferred unit referred to in subsection (1) in respect of each of the calendar years referred to in paragraph (a);
- (c) for each of those specified deferred units in respect of each of those calendar years, specify the calendar year that begins after the end of the useful life of the unit for which the application of subsection 3(1) is to be deferred;
- (d) indicate the registration number of the shut-down unit and of each of the specified deferred units; and
- (e) include information, with supporting documentation, to demonstrate that the conditions of paragraphs (2)(a) to (c) are satisfied.
Granting of deferral
(4) The Minister must, within 30 days after receiving the application, grant the deferral if the following conditions are satisfied:
- (a) the shut-down unit is not a substituted unit referred to in subsection 5(5);
- (b) no deferred unit is a unit that is involved in a temporary exemption granted under subsection 9(3); and
- (c) the Minister is satisfied that the conditions of paragraphs (2)(a) to (c) are satisfied;
No recommencement of shut-down unit
(5) It is prohibited for any person to cause the shut-down unit to recommence producing electricity after the application of subsection 3(1) is deferred in respect of a specified deferred unit.
Changes to deferred units
(6) The responsible person referred to in subsection (1) may change the specified deferred unit in respect of a specified calendar year referred to in paragraph (3)(c) by sending a notice to the Minister if that specified calendar year is not one for which the application of subsection 3(1) has been deferred. The notice must include
- (a) the registration number of the proposed new specified deferred unit;
- (b) the calendar year that begins after the end of the useful life of the proposed new specified deferred unit for which the application of subsection 3(1) is to be deferred; and
- (c) information, with supporting documentation, to demonstrate that the conditions of paragraphs (2)(a) and (b) are satisfied in respect of the proposed new specified deferred unit and the condition of paragraph (2)(c) is satisfied in respect of each specified deferred unit, including the proposed new specified deferred unit, during the calendar year preceding the day on which the notification is sent.
Allowance of changes
(7) The Minister must, within 30 days after receiving the notification, allow the change if the Minister is satisfied that the demonstration referred to in subsection (6) has been made.
Cessation of effect
(8) Despite subsection (1), the deferral ceases to have effect and subsection 3(1) applies in respect of the specified deferred units as of the earliest of
- (a) the calendar year that follows the calendar year in which the application is made, if a shut-down unit referred to in subsection (1) has not ceased to produce electricity by January 1 of that following calendar year,
- (b) any calendar year in which a shut-down unit referred to in subsection (1) recommences to produce electricity,
- (c) the calendar year that follows the day on which the Minister receives a notice from the responsible person for the shut-down unit and the deferred units indicating that they wish the deferral to no longer have an effect,
- (d) the calendar year that follows the day on which the condition of paragraph (2)(a) is no longer satisfied, and
- (e) the calendar year that follows a specified calendar year referred to in paragraph (3)(c) in which the specified deferred unit referred to in that paragraph had a production capacity greater than the production capacity of the shut-down unit during the calendar year preceding the day on which it ceased production.
EMERGENCY CIRCUMSTANCES
Conditions for application
7. (1) A responsible person for a unit may, under emergency circumstances described in subsection (2), apply to the Minister for an exemption from the application of subsection 3(1) in respect of the unit if the following conditions are satisfied:
- (a) as a result of the emergency circumstances, there is a disruption, or a significant risk of disruption, to the electricity supply in the province where the unit is located; and
- (b) the operation of the unit will end, decrease the risk of, or mitigate the consequences of, the disruption.
Criteria of emergency circumstances
(2) An emergency circumstance is a circumstance
- (a) that arises due to an extraordinary, unforeseen and irresistible event; or
- (b) under which one or more of the measures referred to in paragraph 1(a) of the Regulations Prescribing Circumstances for Granting Waivers Pursuant to Section 147 of the Act has been made or issued in the province where the unit is located.
Application
(3) The responsible person must, within 15 days after the emergency circumstance arises, provide the Minister with their application. The application must include the unit’s registration number, the date on which the emergency circumstance arose and information, with supporting documentation, to demonstrate that the conditions of paragraphs (1)(a) and (b) are satisfied.
Granting of exemption
(4) The Minister must, within 30 days after receiving the application, grant the exemption if the Minister is satisfied that the conditions of paragraphs (1)(a) and (b) are satisfied.
Period of exemption
(5) The exemption has effect as of the day on which the emergency circumstance arose and ceases to have effect on the earliest of
- (a) the day that is 90 days after that day,
- (b) the day specified by the Minister, and
- (c) the earlier of
- (i) the day on which the event referred to in paragraph (2)(a) ceases to cause a disruption, or a significant risk of disruption, to the electricity supply in the province where the unit is located, and
- (ii) the day on which the measure, if any,
referred to in paragraph (2)(b) ceases to be in effect.
- (i) the day on which the event referred to in paragraph (2)(a) ceases to cause a disruption, or a significant risk of disruption, to the electricity supply in the province where the unit is located, and
Extension
8. (1) If paragraphs 7(1)(a) and (b) will continue to apply on and after the day on which an exemption granted under subsection 7(4) is to cease to have effect, the responsible person may, before that day, apply to the Minister for an extension of the exemption.
Application
(2) The application must include the unit’s registration number and information, with supporting documentation, to demonstrate that
- (a) paragraphs 7(1)(a) and (b) will continue to apply after the day on which the exemption is to cease to have effect; and
- (b) steps — other than the operation of the unit during the period of the exemption — have been, and are being, taken to end, decrease the risk of, or mitigate the consequences of, the disruption.
Granting of extension
(3) The Minister must, within 15 days after receiving the application, grant the extension if the Minister is satisfied that paragraphs (2)(a) and (b) have been demonstrated.
Duration
(4) The extension ceases to have effect on the earliest of
- (a) the day that is 90 days after the day on which the application for the extension was made,
- (b) the day specified by the Minister, and
- (c) the day referred to in paragraph 7(5)(c).
CARBON CAPTURE AND STORAGE
Temporary Exemption — System to be Constructed
Application
9. (1) A responsible person for a new unit or an old unit may apply to the Minister for a temporary exemption from the application of subsection 3(1) in respect of the unit if
- (a) in the case of a new unit, the unit is designed to permit its integration with a carbon capture and storage system; and
- (b) in the case of an old unit, the unit may be retrofitted to permit its integration with a carbon capture and storage system.
Granting and content of application
(2) The application must indicate the unit’s registration number and include the following supporting documents and information:
- (a) a declaration that includes statements indicating that
- (i) based on the economic feasibility study referred to in paragraph (b), the unit, when operating with an integrated carbon capture and storage system is, to the best of the responsible person’s knowledge and belief, economically viable, and
- (ii) based on the technical feasibility study referred to in paragraph (c) and the implementation plan referred to in paragraph (e), the responsible person expects to satisfy the requirements set out in section 10 and, as a result, to be in compliance with subsection 3(1) by January 1, 2025;
- (i) based on the economic feasibility study referred to in paragraph (b), the unit, when operating with an integrated carbon capture and storage system is, to the best of the responsible person’s knowledge and belief, economically viable, and
- (b) an economic feasibility study that demonstrates the economic viability of the unit when it operates with an integrated carbon capture and storage system and that
- (i) provides project cost estimates, with their margin of error, for the construction of the integrated carbon capture and storage system, and
- (ii) identifies the source of financing for that construction;
- (i) provides project cost estimates, with their margin of error, for the construction of the integrated carbon capture and storage system, and
- (c) a technical feasibility study that establishes — based on information referred to in Schedule 2 related to the capture, transportation and storage elements of the carbon capture and storage system — that there are no insurmountable technical barriers to carrying out the following activities:
- (i) capturing a sufficient volume of CO2 emissions from the combustion of fossil fuels in the unit to enable the responsible person to comply with subsection 3(1),
- (ii) transporting the captured CO2 emissions to suitable geological sites for storage, and
- (iii) storing the captured CO2 emissions in those suitable geological sites;
- (i) capturing a sufficient volume of CO2 emissions from the combustion of fossil fuels in the unit to enable the responsible person to comply with subsection 3(1),
- (d) a description of any work that has been done to satisfy the requirements set out in section 10, along with the information referred to in Schedule 3 with respect to that work; and
- (e) an implementation plan that provides a description of the work to be done, with a schedule for the steps necessary to achieve the following objectives:
- (i) satisfaction of the requirements set out in section 10, and
- (ii) compliance of the responsible person with subsection 3(1) by January 1, 2025 when the unit is operating with an integrated carbon capture and storage system that captures CO2 emissions from the combustion of fossil fuels in the unit in accordance with the laws of Canada or a province that regulate that capture and that transports and stores those emissions in accordance with the laws of Canada or a province, or of the United States or one of its states, that regulate that transportation or storage, as the case may be.
- (i) satisfaction of the requirements set out in section 10, and
Granting of temporary exemptioni
(3) The Minister must, within 120 days after receiving the application, grant the temporary exemption if
- (a) the application includes the documents referred to in subsection (2); and
- (b) the information contained in those documents can reasonably be regarded as establishing that
- (i) the unit, when operating with an integrated carbon capture and storage system, will be economically viable,
- (ii) the capture, transportation and storage elements of the carbon capture and storage system will be technically feasible,
- (iii) if applicable, a requirement set out in section 10 has been satisfied by work done before the application was made, and
- (iv) the responsible person will satisfy the requirements set out in section 10 and, as a result, will be in compliance with subsection 3(1) by January 1, 2025 when the unit is operating with an integrated carbon capture and storage system.
- (i) the unit, when operating with an integrated carbon capture and storage system, will be economically viable,
Duration
(4) A temporary exemption, unless revoked under section 13, remains in effect until December 31, 2024.
Requirements
10. A responsible person who has been granted a temporary exemption in respect of a unit under subsection 9(3) must satisfy the following requirements:
- (a) carry out a front end engineering design study is to be carried out by January 1, 2020;
- (b) purchase any major equipment that is necessary for the capture element is to be purchased by January 1, 2021;
- (c) enter into any contract required for the transportation and storage of CO2 emissions from the unit is to be entered into by January 1, 2022;
- (d) take all necessary steps to obtain all permits or approvals required in relation to the construction of the capture element are to be taken by January 1, 2022; and
- (e) ensure that the unit, when operating with an integrated carbon capture and storage system, captures CO2 emissions from the combustion of fossil fuels in the unit in accordance with the laws of Canada or a province that regulate that capture and transports and stores those emissions in accordance with the laws of Canada or a province, or of the United States or one of its states, that regulate that transportation or storage, as the case may be, by January 1, 2024.
Implementation report
11. (1) A responsible person who has been granted a temporary exemption in respect of a unit must, for each calendar year following the granting of the temporary exemption, provide the Minister with an implementation report that indicates the unit’s registration number and includes supporting documents that contain the following information:
- (a) the steps taken during that year to construct the capture, transportation and storage elements of the carbon capture and storage system and to integrate those elements with the unit;
- (b) any requirement set out in section 10 that was satisfied during that year, along with the information and documents referred to in Schedule 3;
- (c) a description of the manner in which those steps were carried out or those requirements were satisfied;
- (d) any changes, with respect to the information most recently provided to the Minister, to the proposed engineering design for the capture element, to the preferred transportation methods or routes or to the preferred storage sites, for the carbon capture and storage system; and
- (e) a description of any steps necessary, with a schedule for those steps, to achieve the following objectives:
- (i) the satisfaction of any requirements set out in section 10 that remain to be satisfied, and
- (ii) the compliance of the responsible person with subsection 3(1) by January 1, 2025 when the unit is operating with an integrated carbon capture and storage system that captures CO2 emissions from the combustion of fossil fuels in the unit in accordance with laws of Canada or a province that regulate that capture and transports and stores those emissions in accordance with laws of Canada or a province, or of the United States or one of its states, that regulate, as the case may be, that transportation or storage.
- (i) the satisfaction of any requirements set out in section 10 that remain to be satisfied, and
Due date
(2) The implementation report must be provided by March 31 of the calendar year that follows the calendar year in question.
Updated information
12. If any event occurs or any circumstance arises that may prejudice the ability of the responsible person to achieve an objective referred to in paragraph 11(1)(e), the responsible person must send to the Minister, without delay, a notice that indicates the unit’s registration number and contains the following information:
- (a) a description of the event or circumstance and the nature of the prejudice;
- (b) an explanation of how the prejudice is to be overcome in order to ensure that the objective will be achieved; and
- (c) in relation to that explanation, an update to any information previously provided to the Minister under paragraphs 11(1)(c) to (e), together with any necessary supporting documents.
Revocation — non-satisfaction or misleading information
13. (1) The Minister must revoke a temporary exemption granted under subsection 9(3) if
- (a) the responsible person does not satisfy a requirement set out in section 10; or
- (b) any information indicated or contained in the application for the temporary exemption, in an implementation report referred to in section 11 or in a notice referred to in section 12 is false or misleading.
Revocation — implementation report or reasonable grounds
(2) The Minister may revoke the temporary exemption if
- (a) the responsible person has not provided an implementation report in accordance with section 11;
- (b) there are reasonable grounds for the Minister to believe that the carbon capture and storage system will not operate so as to capture, transport and store CO2 emissions as described in paragraph 10(e) by the date referred to in that paragraph; or
- (c) there are reasonable grounds for the Minister to believe that the responsible person will not emit CO2 from the combustion of fossil fuels in the unit in accordance with subsection 3(1) by January 1, 2025.
Reasons and representations
(3) The Minister must not revoke the temporary exemption under subsection (1) or (2) unless the Minister has provided the responsible person with
- (a) written reasons for the proposed revocation; and
- (b) an opportunity to be heard, by written representation, in respect of the proposed revocation.
Twenty-four Month Exemption — Existing Unit with System
Exemption
14. (1) A responsible person for an old unit may, on application made to the Minister, be exempted from the application of subsection 3(1) in respect of the old unit for a period of 24 consecutive months that begins on January 1 of the calendar year that follows the calendar year in which the application is made if the following conditions are satisfied:
- (a) an existing unit and the old unit have a common owner who has a ownership interest of 50% or more in each of those two units;
- (b) the production capacity of the existing unit, during the calendar year preceding the calendar year in which the application is made, was equal to or greater than the production capacity of the old unit during that preceding calendar year;
- (c) the existing unit and the old unit are located in the same province;
- (d) the quantity of CO2 emissions from the combustion of fossil fuels in the existing unit are determined in an accordance with a system or method referred to in subsection 20(1);
- (e) the quantity of CO2 emissions from the combustion of fossil fuels in the existing unit that are captured, transported and stored is determined using a direct measure of the flow of, and the concentration of CO2 in, the emissions from that combustion of fuel;
- (f) the emissions referred to in paragraph (e) are captured in accordance with the laws of Canada or a province that regulate that capture and are transported and stored in accordance with the laws of Canada or a province, or of the United States or one of its states, that regulate that transportation or storage, as the case may be;
- (g) the emissions referred to in paragraph (e) are captured, transported and stored for a period of seven consecutive calendar years;
- (h) the emissions referred to in paragraph (e) comprise at least 30% of the quantity of CO2 emissions produced from the combustion of fossil fuels in the existing unit for each calendar year during that seven-year period; and
- (i) the existing unit does not reach the end of its useful life during that seven-year period.
Application
(2) A responsible person for an old unit must apply for the exemption before September 1 of the calendar year preceding the calendar year for which the exemption is sought.
Contents
(3) The application must include the registration number of the old unit and of the existing unit and information, with supporting documentation, to demonstrate that
- (a) the conditions of paragraphs (1)(a) to (f), (h) and (i) are satisfied; and
- (b) at least 30 consecutive months of the period referred to in paragraph (g) have occurred before the day on which the application is made.
Granting of exemption
(4) The Minister must, within 30 days after receiving the application, grant the exemption if
- (a) no exemption referred to in subsection (1) has been previously granted in respect of the old unit;
- (b) no exemption referred to in subsection (1) that involved the existing unit has been previously granted;
- (c) the existing unit referred to in subsection (1) is not a substituted unit referred to in subsection 5(5); and
- (d) the Minister is satisfied that the requirements set out in subsection (3) are satisfied.
Obligation to capture 30% of CO2 emissions
(5) A responsible person who has been exempted under subsection (4) in respect of an existing unit must ensure that the conditions of paragraphs (1)(a) to (f), (h) and (i) are satisfied for the portion of the period referred to in paragraph (1)(g) that remains after the occurrence of the period of consecutive months described in paragraph (3)(b).
PART 2
REPORTING, SENDING, RECORDING AND RETENTION OF INFORMATION
Annual report
15. For each calendar year, a responsible person for each of the following units must, on or before June 1 that follows that calendar year, send an annual report to the Minister that contains the information set out in Schedule 4:
- (a) a new unit;
- (b) an old unit;
- (c) a substituted unit referred to in subsection 5(5);
- (d) an existing unit referred to in subsection 14(1), if that calendar year is a calendar year included in the remaining portion of the seven consecutive calendar years referred to in subsection 14(5).
Electronic report, notice and application
16. (1) A report or notice that is required, or an application that is made, under these Regulations must be sent electronically in the form and format specified by the Minister and must bear the electronic signature of an authorized official of the responsible person.
Paper report or notice
(2) If the Minister has not specified an electronic form and format or if it is impractical to send the report, notice or application electronically in accordance with subsection (1) because of circumstances beyond the person’s control, the report, notice or application must be sent on paper, signed by an authorized official of the responsible person, and in the form and format specified by the Minister. However, if no form and format have been so specified, it may be in any form and format.
Record-making
17. (1) A responsible person for a unit must make a record
- (a) of any notice referred to in subsection 4(3), 5(6) or 6(6) or section 12 that was sent to the Minister and the information that was contained in it, as well as any supporting documents;
- (b) of any application referred to in subsection 5(3), 6(3), 7(3), 8(2), 9(2) or 14(3) and the information referred to in the subsection, as well as any supporting documents;
- (c) of every direct measure of the flow of, and the concentration of CO2 in, emissions referred to in paragraph 14(1)(e), subsection 20(2) and the descriptions of Enon-ccs in subsection 21(1) and of Eccs in section 22;
- (d) of every measurement and calculation used to determine a value of an element of a formula set out in any of sections 19 and 21 to 24;
- (e) that demonstrates that any meter referred to in section 19 complies with the requirements of the Electricity and Gas Inspection Act and the Electricity and Gas Inspection Regulations, including a certificate referred to in section 14 of that Act;
- (f) for each calendar year during which a responsible person used a continuous emission monitoring system referred to in paragraph 20(1)(a), of any document, record or information referred to in section 8 of the Reference Method;
- (g) that demonstrates that the installation, maintenance and calibration of measuring devices referred to in subsection 25(1) was in accordance with that subsection and subsection 25(3) and of every calibration referred to in subsection 25(2); and
- (h) of the results of the analysis of every sample collected in accordance with section 27.
When records made
(2) Records referred to in paragraphs (1)(c) to (h) must be made as soon as feasible but not later than 30 days after the information to be recorded becomes available.
Retention of records and reports
18. (1) A responsible person who is required under these Regulations to make a record or send a report or notice must keep the record or a copy of the report or notice, as well as any supporting documents that relate to the information contained in that record or copy, for at least seven years after they make the record or send the report or notice. The record or copy must be kept at the person’s principal place of business in Canada or at any other place in Canada where it can be inspected. If the record or copy is kept at any of those other places, the person must provide the Minister with the civic address of that other place.
Change of address
(2) If the civic address referred to in subsection (1) changes, the responsible person must notify the minister in writing within 30 days after the change.
PART 3
QUANTIFICATION RULES
PRODUCTION OF ELECTRICITY
Electricity
19. (1) The quantity of electricity referred to in paragraph 3(2)(a) is to be determined in accordance with the following formula:
Ggross − Gaux
where
Ggross is the gross quantity of electricity that is produced by the unit during the calendar year, expressed in GWh and measured at the electrical terminals of the generators of the unit using meters that comply with the requirements of the Electricity and Gas Inspection Act and the Electricity and Gas Inspection Regulations; and
Gaux is the quantity of electricity that is used by the power plant in which the unit is located during the calendar year to operate infrastructure and equipment that is attributed to the unit for electricity generation and for separation, but not for pressurization, of CO2, expressed in GWh , determined in accordance with an appropriate method of attribution, based on data collected using meters that comply with the requirements of the Electricity and Gas Inspection Act and the Electricity and Gas Inspection Regulations.
Same method of attribution in subsequent years
(2) Once a method of attribution is used to make the determination referred to in the description of Gaux for a calendar year, that method of attribution must be used to make that determination for every subsequent calendar year, unless
- (a) during a subsequent calendar year, a unit located at the power plant ceases to produce electricity or a new unit is added to those located at the power plant; or
- (b) during a subsequent calendar year, the operation of any unit located at the power plant is integrated with a carbon capture and storage system.
Change of method of attribution
(3) If paragraph (2)(a) or (b) applies in a subsequent calendar year, the responsible person must, when making the determination referred to in the description of Gaux in subsection (1) for that subsequent calendar year, use a method of attribution that is appropriate to the circumstances described in that paragraph. Subsection (2) applies in respect of that appropriate method of attribution and that subsequent calendar year as if they were, respectively, the method of attribution and the calendar year referred to in that subsection.
CO2 EMISSIONS
Means of Quantification
CEMS or fuel-based methods
20. (1) For the purposes of sections 3 and 15, the quantity of CO2 emissions from the combustion of fossil fuels in a unit for a calendar year is to be determined
- (a) by using a continuous emission monitoring system (CEMS) in accordance with section 21; or
- (b) by using a fuel-based method, based on the quantity of carbon in the fossil fuel fed for combustion, in accordance with section 22 and section 23 or 24.
Emissions from coal gasification systems
(2) If a coal gasification system referred to in subsection 3(4) is used to produce fuel for a unit, the quantity of emissions from the unit referred to in subsection (1) must be determined in accordance with paragraph (1)(a). To the extent that the emissions from the coal gasification system are not captured, transported and stored as described in subsection 3(5), that quantity must be determined for the purpose of subsection 3(1) by using a direct measure of the flow of, and the concentration of CO2 in, those emissions.
Continuous Emissions Monitoring System
Quantification
21. (1) If paragraph 20(1)(a) applies, the quantity of CO2 emissions referred to in subsection 20(1) is to be determined in accordance with the following formula:
Eu − Ebio + Enon-ccs
where
Eu is the quantity of CO2 emissions, expressed in tonnes, from the unit, “u”, during the calendar year from the combustion of fuel, as measured by the CEMS in accordance with sections 7.1 to 7.7 of the Reference Method;
Ebio is the quantity of CO2 emissions, expressed in tonnes, from the combustion of biomass in the unit during the calendar year, determined
- (a) by using a fuel-based method
- (i) in accordance with paragraph 24(1)(a) or (b), if the unit combusts solid biomass at an average daily rate of less than 3t/day during the given calendar year, and
- (ii) in accordance with the applicable formula set out in one of paragraphs 23(1)(a) to (c) for the type of biomass combusted, in any other case, or
- (i) in accordance with paragraph 24(1)(a) or (b), if the unit combusts solid biomass at an average daily rate of less than 3t/day during the given calendar year, and
- (b) by using the method, based on data from the CEMS, described in subsection (2); and
Enon-ccs is the quantity of CO2 emissions, expressed in tonnes, from the combustion of fuel in the unit, including those emissions referred to in subsection 3(4), during the calendar year — other than the quantity of those emissions as measured by the CEMS and set out in the description of Eu — that is determined using a direct measure of the flow of, and the concentration of CO2 in, the emissions from that combustion of fuel but that is not ultimately captured, transported and stored as described in subsection 3(5).
Ebio based on CEMS data
(2) For the purpose of determining the value of Ebio, the method, based on data from the CEMS, consists of making the following sequence of determinations:
- (a) the volume of CO2 emitted from combustion of fuel in the unit for each hour of production of electricity during the calendar year determined in accordance with the following formula:
0.01 × %CO2w,h × Qw,h × th
where
%CO2w,h is the average concentration of CO2 in relation to all gases in the stack emitted from the combustion of fuel in the unit during a given hour, “h”, during which the unit produced electricity in the calendar year — or, if applicable, a calculation made in accordance with section 7.4 of the Reference Method of that average concentration of CO2 based on a measurement of the concentration of oxygen (O2) in those gases in the stack — expressed as a percentage on a wet basis,
Qw,his the average volumetric flow during that hour, measured on a wet basis by the stack gas volumetric flow monitor, expressed in standard m3, and
th is the period during which the unit produced electricity, expressed in hours;
- (b) the volume of CO2 emitted from combustion of fossil fuel in the unit during the calendar year, expressed in standard m3 and referred to in this subsection as Vff, determined in accordance with the following formula:
where
Qi is the quantity of fossil fuel type “i” combusted in the unit during the calendar year, determined
- (a) for a solid fuel, in the same manner as the one used in the determination of Mf in the formula set out in paragraph 23(1)(a) and expressed in tonnes,
- (b) for a liquid fuel, in the same manner as the one used in the determination of Vf in the formula set out in paragraph 23(1)(b) and expressed in kL, and
- (c) for a gaseous fuel, in the same manner as the one used in the determination of Vf in the formula set out in paragraph 23(1)(c) and expressed in standard m3,
i is the ith fossil fuel type combusted in the unit during the calendar year, with “i” going from the number 1 to n, where n is the number of fossil fuels so combusted,
Fc,i is the fuel-specific carbon-based F-factor for each fossil fuel type “i” — being, as the case may be, the default value as set out in column 3 of the table to subsection (3) for that fuel type set out in column 2 or determined for that fuel type in accordance with Appendix A of the Reference Method — expressed in standard m3 of CO2/GJ,
HHVd,i — expressed in GJ/tonne, for a solid fuel, in GJ/kL, for a liquid fuel, and in GJ/standard m3, for a gaseous fuel — is, for each fossil fuel type “i”,
- (a) the default higher heating value set out in column 2 of Schedule 5 for that fuel type set out in column 1, and
- (b) in the absence of a default higher heating value for that fuel type referred to in paragraph (a), a default higher heating value for that fuel type established by a body that is internationally recognized as being competent to establish default higher heating values for fuels;
- (c) the volume of CO2 emitted from the combustion of biomass in the unit during the calendar year, expressed in standard m3 and referred to in this subsection as Vbio, determined in accordance with the following formula:
VT − Vff
where
VT is the sum of the volumes of CO2 emitted from combustion of fuel in the unit during each hour of production of electricity during the calendar year, as determined under paragraph (a), and
Vff is Vff determined in accordance with the formula set out in paragraph (b); and
- (d) the quantity of the CO2 emissions from the combustion of biomass in the unit during the calendar year, namely Ebio determined in accordance with the formula set out in subsection (1), based on the following two determinations:
- (i) the fraction of the volume of CO2 emissions from all fuel combusted in the unit attributable to the combustion of biomass in the unit during the calendar year, referred to in this section as Biofr, determined in accordance with the following formula:
![]()
where
Vbiois the volume of CO2 emitted from the combustion of biomass in the unit during the calendar year determined in accordance with the formula set out in paragraph (c),
VT is the value of VT determined in accordance with the formula set out in paragraph (c), and
(Biofr× Eu) − Es
where
Biofris the fraction of the volume of CO2 emissions from all fuel combusted in the unit attributable to the combustion of biomass in the unit during the calendar year determined in accordance with the formula set out in subparagraph (i),
Eu is the value of Eu determined in the formula set out in subsection (1), and
Esis the quantity of CO2 emissions, expressed in tonnes, that is released from the use of sorbent to control the emission of sulphur dioxide from the unit during the calendar year, determined in accordance with the following formula:
![]()
where
S is the quantity of calcium carbonate (CaCO3) or other sorbent material so used, expressed in tonnes,
R is the stoichiometric ratio, on a mole fraction basis, of CO2 released on usage of one mole of sorbent material, where R=1 if the sorbent material is CaCO3, and
MMs is the molecular mass of the sorbent material, where MMs = 100 if the sorbent material is CaCO3.
Default F-factor
(3) The default value for the fuel-specific carbon-based F-factor for certain types of fossil fuel is set out in column 3 of the following table:
TABLE
| Item |
Column 1 |
Column 2 |
Column 3 |
|---|---|---|---|
1. |
Coal |
Anthracite |
54.2 |
Bituminous |
49.2 |
||
Sub-bituminous |
49.2 |
||
Lignite |
53.0 |
||
2. |
Oil |
Crude, residual or distillate |
39.3 |
3. |
Gas |
Natural |
28.4 |
Propane |
32.5 |
Common stack — disaggregation
(4) Despite subsection (1), if there is one or more other units at a power plant where a unit is located and a CEMS measures emissions from that unit and from one or more of those other units at a common stack rather than at the exhaust duct of that unit and of each of those other units that brings those emissions to the common stack, then the quantity of emissions attributable to that unit for the purpose of subsection (1) is determined based on the ratio of the heat input of that unit to the total of the heat input of that unit and of all of those other units sharing the common stack in accordance with the following formula:

where
Quj is the quantity of fuel type “j” combusted in that unit “u” during the calendar year, determined
- (a) for a solid fuel, in the same manner as the one used in the determination of Mf in the formula set out in paragraph 23(1)(a) and expressed in tonnes,
- (b) for a liquid fuel, in the same manner as the one used in the determination of Vf in the formula set out in paragraph 23(1)(b) and expressed in kL, and
- (c) for a gaseous fuel, in the same manner as the one used in the determination of Vf in the formula set out in paragraph 23(1)(c) and expressed in standard m3;
HHVuj is the higher heating value, determined in accordance with section 24 and expressed in the applicable unit of measure referred to in that section of fuel type “j” combusted during the calendar year in that unit “u”;
i is the ith unit located at the power plant with “i” going from the number 1 to n, where n is the number of units that share a common stack;
j is the jth fuel type, including types of biomass, combusted during the calendar year in a unit located at the power plant with “j” going from the number 1 to m, where m is the number of those fuel types;
Qij is the quantity of fuel type “j” combusted in each unit “i” during the calendar year, determined for a solid fuel, a liquid fuel and a gaseous fuel, respectively, in the manner set out in the description of Quj;
HHVij is the higher heating value, determined in accordance with section 24 and expressed in the applicable unit of measure referred to in that section, of fuel type “j” combusted during the calendar year in unit “i”; and
E is the quantity of CO2 emissions, expressed in tonnes, from the combustion of fuels in all the units during the calendar year, measured by a CEMS at the common stack in accordance with subsection 21(1).
Fuel-based Methods
Determination
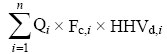
22. If paragraph 20(1)(b) applies, the quantity of CO2 emissions referred to in subsection 20(1) is to be determined by the following formula:
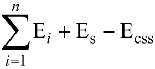
where
Ei is the quantity of CO2 emissions attributable to the combustion of fossil fuel of type “i” in the unit during the calendar year, expressed in tonnes, determined for that fuel type in accordance with section 23 or 24;
i is the ith type of fossil fuel combusted in the unit during the calendar year, with “i” going from the number 1 to n, where n is the number of types of fossil fuel so combusted;
Es is Es determined in accordance with the formula set out in subparagraph 21(2)(d)(ii); and
Eccs is the quantity of CO2 in those emissions, expressed in tonnes, from the combustion of fuel in the unit, during the calendar year, that are captured in accordance with the laws of Canada or a province that regulate that capture and that are transported and stored in accordance with the laws of Canada or a province, or of the United States or one of its states, that regulate that transportation or storage, as the case may be, that quantity being determined using a direct measure of the flow of, and the concentration of CO2 in, those emissions.
Measured carbon content
23. (1) Subject to section 24, the quantity of CO2 emissions attributable to the combustion of a fuel in a unit during a calendar year, expressed in tonnes, is determined in accordance with the applicable formula, as follows:
- (a) for a solid fuel
![]()
where
Mf is the mass of the fuel combusted during the calendar year as determined, as the case may be, on a wet or dry basis, expressed in tonnes and measured by a measuring device, and
CCA is the weighted average, expressed in kg of carbon per kg of the fuel, of the carbon content of the fuel determined in accordance with subsection (2) on the same wet or dry basis as the one used in the determination of Mf;
- (b) for a liquid fuel
![]()
where
Vf is the volume of the fuel combusted during the calendar year, expressed in kL, determined by using flow meters, and
CCA is the weighted average, expressed in tonnes of carbon per kL of the fuel, of the carbon content of the fuel determined in accordance with subsection (2) at the same temperature as the one used in the determination of Vf; and
- (c) for a gaseous fuel

where
Vf is the volume of the fuel combusted during the calendar year, expressed in standard m3, determined by using flow meters,
CCA is the weighted average, expressed in kg of carbon per kg of the fuel, of the carbon content of the fuel determined in accordance with subsection (2),
MMA is the average molecular mass of the fuel, expressed in kg per kg-mole of the fuel, determined based on fuel samples collected in accordance with section 27, and
MVcf is the molar volume conversion factor, namely 23.645 standard m3 per kg-mole of the fuel at standard conditions of 15°C and 101.325 kPa.
Weighted average
(2) The weighted average referred to in paragraphs (1)(a) to (c) as CCA is, based on fuel samples collected in accordance with section 27, to be determined in accordance with the following formula:
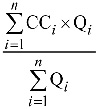
where
CCi is the carbon content of, as the case may be, the composite sample, or the sample, of the fuel for the ith sampling period expressed for solid fuels, liquid fuels and gaseous fuels, respectively, in the same unit of measure as the one set out in CCA, as provided by the supplier of the fuel to the responsible person and, if not so provided, as determined by the responsible person, and measured
- (a) for a solid fuel, on the same wet or dry basis as the one used in the determination of CCA, in accordance with,
- (i) for coal, biomass or solid fuel derived from waste, ASTM D5373 - 08, entitled Standard Test Methods for Instrumental Determination of Carbon, Hydrogen, and Nitrogen in Laboratory Samples of Coal, and
- (ii) for any other solid fuel,
- (A) an applicable ASTM standard for the measurement of the carbon content of the fuel, and
- (B) if no such ASTM standard applies, an applicable internationally recognized method for the measurement of the carbon content of the fuel,
- (b) for a liquid fuel, in accordance with any of the following standards or methods that applies for the measurement of the carbon content of the fuel:
- (i) ASTM D3238 - 95(2010), entitled Standard Test Method for Calculation of Carbon Distribution and Structural Group Analysis of Petroleum Oils by the n-d-M Method, along with either of the following applicable ASTM standards:
- (A) ASTM D2503 - 92(2007), entitled Standard Test Method for Relative Molecular Mass (Molecular Weight) of Hydrocarbons by Thermoelectric Measurement of Vapor Pressure, and
- (B) ASTM D2502 - 04(2009), entitled Standard Test Method for Estimation of Molecular Weight (Relative Molecular Mass) of Petroleum Oils From Viscosity Measurements,
- (ii) ASTM D5291 - 10, entitled Standard Test Methods for Instrumental Determination of Carbon, Hydrogen, and Nitrogen in Petroleum Products and Lubricants, and
- (iii) if no such ASTM standard applies, an applicable internationally recognized method, and
- (i) ASTM D3238 - 95(2010), entitled Standard Test Method for Calculation of Carbon Distribution and Structural Group Analysis of Petroleum Oils by the n-d-M Method, along with either of the following applicable ASTM standards:
- (c) for a gaseous fuel,
- (i) in accordance with either of the following ASTM standards that applies for the measurement of the carbon content of the fuel:
- (A) ASTM D1945 - 03(2010), entitled Standard Test Method for Analysis of Natural Gas by Gas Chromatography, and
- (B) ASTM D1946 - 90(2011), entitled Standard Practice for Analysis of Reformed Gas by Gas Chromatography, or
- (ii) by means of a direct measuring device that determines the carbon content of the fuel;
- (i) in accordance with either of the following ASTM standards that applies for the measurement of the carbon content of the fuel:
i is the ith sampling period referred to in section 27, with “i” going from the number 1 to n, where n is the number of those sampling periods; and
Qi is the mass or volume, as the case may be, of the fuel combusted during the ith sampling period, expressed
- (a) for a solid fuel, in tonnes, on the same wet or dry basis as the one used in the determination of CCA,
- (b) for a liquid fuel, in kL, and
- (c) for a gaseous fuel, in standard m3.
Quantification based on HHV
24. (1) For an eligible fuel referred to in subsection (2), the quantity of CO2 emissions attributable to the combustion of the fuel in a unit during a calendar year, expressed in tonnes, may be determined in accordance with subsection (4) based on the following higher heating value of the fuel:
- (a) the higher heating value of the fuel that is measured in accordance with subsection (6) as provided by the supplier of the fuel to the responsible person but, if not so provided, as so measured by the responsible person; and
- (b) in the absence of a measured higher heating value of the fuel referred to in paragraph (a), the default higher heating value, set out in column 2 of Schedule 5, for the fuel’s type, as set out in column 1 but, in the absence of that default higher heating value, a default higher heating value for that fuel type established by a body that is internationally recognized as being competent to establish default higher heating values for fuels.
Eligible fuels
(2) Eligible fuels are
- (a) a fuel combusted in a unit in respect of which an exemption from the application of subsection 3(1) has been granted under subsection 7(4);
- (b) a fuel referred to in section 23 that is combusted during the calendar year at less than any of the average daily rates referred to in subsection (3);
- (c) a fuel listed in Part 4 of Schedule 5; and
- (d) a fuel combusted in a standby unit.
Average daily rates
(3) The average daily rates are
- (a) for a solid fuel, 3 t/day;
- (b) for a liquid fuel, 1900 L/day; and
- (c) for a gaseous fuel, 500 standard m3/day.
Quantity of emissions
(4) The quantity of emissions is to be determined in accordance with the following formula:
![]()
where
Q is the quantity of the fuel combusted in the unit during the calendar year determined
- (a) for a solid fuel, in the same manner as the one used in the determination of Mf in the formula set out in paragraph 23(1)(a) and expressed in tonnes,
- (b) for a liquid fuel, in the same manner as the one used in the determination of Vf in the formula set out in paragraph 23(1)(b) and expressed in kL, and
- (c) for a gaseous fuel, in the same manner as the one used in the determination of Vf in the formula set out in paragraph 23(1)(c) and expressed in standard m3;
HHV — expressed in GJ/tonne, for a solid fuel, in GJ/kL, for a liquid fuel, and in GJ/ standard m3, for a gaseous fuel — is
- (a) if paragraph (1)(a) applies, the weighted average higher heating value of the fuel, determined in accordance with subsection (5), based on fuel samples collected in accordance with section 27, and
- (b) if paragraph (1)(b) applies, the default higher heating value, set out in column 2 of Schedule 5, for the fuel’s type, as set out in column 1 and, in the absence of that default higher heating value, a default higher heating value for that fuel type established by a body that is internationally recognized as being competent to establish default higher heating values for fuels; and
EF is the default CO2 emission factor, set out in column 3 of Schedule 5, for that fuel listed in column 1 and, in the absence of that default CO2 emission factor, a default CO2 emission factor for that fuel established by a body that is internationally recognized as competent to establish default CO2 emission factors for fuels.
Weighted average
(5) The weighted average higher heating value of the fuel is determined in accordance with the following formula:

where
HHVi is the higher heating value of, as the case may be, each composite sample, or sample, of the fuel for the ith sampling period measured in accordance with subsection (6), as provided by the supplier of the fuel to the responsible person but, if not so provided, as so measured by the responsible person;
i is the ith sampling period referred to in section 27, with “i” going from the number 1 to n, where n is the number of those sampling periods; and
Qi is the mass or volume, as the case may be, of the fuel combusted during the ith sampling period, expressed
- (a) for a solid fuel, in the same manner as the one used in the determination of Mf in the formula set out in paragraph 23(1)(a) and expressed in tonnes,
- (b) for a liquid fuel, in the same manner as the one used in the determination of Vf in the formula set out in paragraph 23(1)(b) and expressed in kL, and
- (c) for a gaseous fuel, in the same manner as the one used in the determination of Vf in the formula set out in paragraph 23(1)(c) and expressed in standard m3.
Measurement of HHV
(6) The higher heating value of a fuel is to be measured
- (a) for a solid fuel that is
- (i) coal or biomass, in accordance with ASTM D5865 - 11a, entitled Standard Test Method for Gross Calorific Value of Coal and Coke,
- (ii) a fuel derived from waste, in accordance with either ASTM D5865 - 11a or ASTM D5468 - 02(2007), entitled Standard Test Method for Gross Calorific and Ash Value of Waste Materials, and
- (iii) any other solid fuel type,
- (A) in accordance with an applicable ASTM standard for the measurement of the higher heating value of the fuel, and
- (B) if no such ASTM standard applies, in accordance with an applicable internationally recognized method; and
- (A) in accordance with an applicable ASTM standard for the measurement of the higher heating value of the fuel, and
- (i) coal or biomass, in accordance with ASTM D5865 - 11a, entitled Standard Test Method for Gross Calorific Value of Coal and Coke,
- (b) for a liquid fuel that is
- (i) an oil or a liquid fuel derived from waste, in accordance with
- (A) ASTM D240 - 09, entitled Standard Test Method for Heat of Combustion of Liquid Hydrocarbon Fuels by Bomb Calorimeter, or
- (B) ASTM D4809 - 09a, entitled Standard Test Method for Heat of Combustion of Liquid Hydrocarbon Fuels by Bomb Calorimeter (Precision Method), and
- (A) ASTM D240 - 09, entitled Standard Test Method for Heat of Combustion of Liquid Hydrocarbon Fuels by Bomb Calorimeter, or
- (ii) any other liquid fuel type,
- (A) in accordance with an applicable ASTM standard for the measurement of the higher heating value of the fuel, and
- (B) if no such ASTM standard applies, in accordance with an applicable internationally recognized method; and
- (A) in accordance with an applicable ASTM standard for the measurement of the higher heating value of the fuel, and
- (i) an oil or a liquid fuel derived from waste, in accordance with
- (c) for a gaseous fuel,
- (i) in accordance with any of the following applicable ASTM or GPA standards:
- (A) ASTM D1826 - 94(2010), entitled Standard Test Method for Calorific (Heating) Value of Gases in Natural Gas Range by Continuous Recording Calorimeter,
- (B) ASTM D3588 - 98(2003), entitled Standard Practice for Calculating Heat Value, Compressibility Factor, and Relative Density of Gaseous Fuels,
- (C) ASTM D4891 - 89(2006), entitled Standard Test Method for Heating Value of Gases in Natural Gas Range by Stoichiometric Combustion,
- (D) GPA Standard 2172 - 09, entitled Calculation of Gross Heating Value, Relative Density, Compressibility and Theoretical Hydrocarbon Liquid Content for Natural Gas Mixtures for Custody Transfer, and
- (E) GPA standard 2261 - 00, entitled Analysis for Natural Gas and Similar Gaseous Mixtures by Gas Chromatography, or
- (A) ASTM D1826 - 94(2010), entitled Standard Test Method for Calorific (Heating) Value of Gases in Natural Gas Range by Continuous Recording Calorimeter,
- (ii) by means of a direct measuring device that determines the higher heating value of the fuel, but if the measuring device provides only lower heating values, those lower heating values must be converted to the corresponding higher heating values.
- (i) in accordance with any of the following applicable ASTM or GPA standards:
ACCURACY OF DATA
Measuring devices — installation, maintenance and calibration
25. (1) A responsible person for a unit must install, maintain and calibrate any measuring device — other than a CEMS referred to in paragraph 20(1)(a) and any measuring device that is subject to the Electricity and Gas Inspection Act — that is used for the purpose of section 3 or 15 in accordance with the manufacturer’s instructions or any applicable generally recognized national or international industry standard.
Frequency of calibration
(2) The responsible person must calibrate each of those measuring devices at the greater of the following two frequencies:
- (a) at least once in every calendar year but at least five months after a previous calibration, and
- (b) the minimum frequency recommended by the manufacturer.
Accuracy of measurements
(3) Each of those measuring devices must enable measurements to be made with a margin of error of ± 5%.
CEMS
26. (1) A responsible person who uses a CEMS referred to in paragraph 20(1)(a) for the purpose of section 3 or 15 must ensure that the Reference Method is complied with.
Certification
(2) Before a CEMS referred to in paragraph 20(1)(a) is used for the purpose of that paragraph, it must be certified by the responsible person in accordance with section 5 of the Reference Method.
Annual audit
(3) For each calendar year during which a responsible person uses a CEMS referred to in paragraph 20(1)(a), an auditor must
- (a) assess, based on the review referred to in section 6.5.2 of the Reference Method, whether, in the auditor’s opinion, the responsible person’s use of the CEMS complied with the Quality Assurance/Quality Control manual referred to in section 6 of the Reference Method;
- (b) ensure that the Quality Assurance/Quality Control manual has been updated in accordance with sections 6.1 and 6.5.2 of the Reference Method; and
- (c) assess whether, in the auditor’s opinion, the responsible person complied with the Reference Method and the CEMS met the specifications set out in the Reference Method, in particular, in its sections 3 and 4.
Auditor’s report
(4) The responsible person must obtain a report, signed by the auditor, that contains the information set out in Schedule 6 and send the auditor’s report to the Minister with their annual report referred to in section 15.
FUEL SAMPLING AND TESTING REQUIREMENTS
Fuel sampling
27. (1) The determination of the value for the elements related to carbon content and higher heating values referred to in sections 21 to 24 must be based on fuel samples taken in accordance with this section.
Frequency
(2) Each fuel sample must be taken at a time and location in the fuel handling system of the power plant that provides the following representative sample of the fuel combusted at the following minimum frequency:
- (a) for coal other than synthetic gas derived from coal or derived from petroleum coke, one composite sample, during each week that the unit produces electricity, that is prepared in accordance with ASTM D2013 / D2013M - 11, entitled Standard Practice for Preparing Coal Samples for Analysis, and that consists of sub-samples taken at least twice from coal that was fed for combustion during that week and at least 48 hours apart, in accordance with
- (i) ASTM D2234 / D2234M - 10, entitled Standard Practice for Collection of a Gross Sample of Coal, or
- (ii) ASTM D7430 - 11ae1, entitled Standard Practice for Mechanical Sampling of Coal;
- (i) ASTM D2234 / D2234M - 10, entitled Standard Practice for Collection of a Gross Sample of Coal, or
- (b) for a type of solid fuel other than coal, one composite sample per month that consists of sub-samples of fuel of that type, each having the same mass, that were taken from fuel that was fed for combustion during each week that begins in that month and during which the unit produces electricity and that were taken at least 48 hours after any previous sub-sample and after all fuel treatment operations had been carried out but before any mixing of the fuel from which the sub-sample is taken with other fuels;
- (c) for a type of liquid fuel and of a gaseous fuel other than natural gas, one sample per quarter, with each sample of fuel of that type being taken at least one month after any previous sample has been taken; and
- (d) for natural gas, two samples per calendar year, with each sample being taken at least four months after any previous sample has been taken.
Additional samples
(3) For greater certainty, the responsible person who takes, for the purpose of these Regulations, more samples than the minimum required under subsection (2) must make the determination referred to in subsection (1) based on each sample — and, in the case of composite samples, each sub-sample — taken, including those additional samples.
Missing Data
28. (1) Subject to subsections (2) and (3), if, for any reason beyond the responsible person’s control, the emission-intensity referred to in subsection 3(1) cannot be determined in accordance with a formula set out in any of sections 19 and 21 to 24 because data required to determine the value of an element of that formula has not been obtained for a given period during a calendar year, replacement data for that given period obtained in accordance with an appropriate method must be used to determine that value.
Replacement data — CEMS
(2) If a CEMS referred to in paragraph 20(1)(a) is used for the determination of an element of a formula set out in section 21 but data has not been obtained for that determination during a given period, the replacement data is to be obtained in accordance with section 3.5.2 of the Reference Method.
Replacement data — Fuel-based methods
(3) If a fuel-based method referred to in paragraph 20(1)(b) is used for the determination of an element — related to the higher heating value, carbon content or molecular mass of a fuel — of a formula set out in any of sections 21 to 24 for which data has not been obtained during a given period, the replacement data is to be the average of the determinations for that element, using the fuel-based method in question, during the equivalent period prior to and, if available, subsequent to that given period. However, if the determination of that element is not available during the equivalent period prior to that given period, the replacement data is to be the determination for that element, using the fuel-based method in question, during the equivalent period subsequent to the given period.
Replacement data — multiple periods
(4) During a calendar year, there may be more than one given period, but replacement data may be obtained under subsection (1) or (3) for a maximum of 28 days during the calendar year, distributed among any or all of those periods.
PART 4
COMING INTO FORCE
July 1, 2015
29. (1) Subject to subsections (2) and (3), these Regulations come into force on July 1, 2015.
January 1, 2013
(2) Sections 1, 2 and 4, subsections 5(1) to (4) and sections 9 to 14 and 29 come into force on January 1, 2013.
January 1, 2030
(3) Section 3, in respect of standby units, comes into force on January 1, 2030.
SCHEDULE 1
(Subsection 4(1))
REGISTRATION REPORT — INFORMATION REQUIRED
1. The following information respecting the responsible person:
- (a) an indication of whether they are the owner or operator of the unit and their name and civic address;
- (b) the name, title, civic and postal addresses, telephone number and, if any, email address and fax number, of their authorized official; and
- (c) the name, title, civic and postal addresses, telephone number and, if any, email address and fax number, of a contact person, if different from the authorized official.
2. The following information respecting the unit:
- (a) for each responsible person for the unit, other than the responsible person mentioned in paragraph 1(a), if any
- (i) their name and civic address,
- (ii) an indication of whether they are an owner or operator, and
- (iii) in the case of an owner, their percentage of ownership interest;
- (i) their name and civic address,
- (b) its name and civic address, if any;
- (c) if applicable, its National Pollutant Release Inventory identification number assigned by the Minister for the purpose of section 48 of the Act;
- (d) for an existing or old unit
- (i) the calendar year in which it reaches, or has reached, the end of its useful life, and
- (ii) an indication of whether it will cease to produce electricity for sale before July 1, 2015 and, if known, the date by which it will cease production;
- (i) the calendar year in which it reaches, or has reached, the end of its useful life, and
- (e) its commissioning date; and
- (f) its production capacity.
SCHEDULE 2
(Paragraph 9(2)(c))
TECHNICAL FEASIBILITY STUDY — INFORMATION REQUIRED
1. The following information respecting the capture element of the carbon capture and storage system:
- (a) a description of how the emissions are to be captured, including a preliminary engineering design and a description of the preferred technology and processes to be used;
- (b) a description of the principal modifications to the unit that are needed for its integration with the capture element to enable the responsible person to comply with subsection 3(1) of these Regulations;
- (c) an identification of any major equipment to be installed and of any other significant equipment to be modified or replaced;
- (d) process flow diagrams and mass and energy balances, including external energy inputs;
- (e) a summary of auxiliary energy loads;
- (f) an estimate of the unit’s production capacity when it is operating with an integrated capture element;
- (g) an estimate of the unit’s gross quantity of electricity produced for a calendar year — set out in the description of Ggross in subsection 19(1) of these Regulations — when it is operating with an integrated capture element;
- (h) an estimate of the rate of capture of CO2 emissions and of the volume of CO2 emissions, expressed in standard m3, to be captured for a calendar year and for the operating life of the unit;
- (i) a preliminary resource analysis for the unit when it is operating with an integrated capture element, including water consumption, heat and power consumption, raw material consumption and fuel consumption;
- (j) documents establishing that adequate space has been set aside at the power plant in which the unit is located and that adequate access is to be provided for the purpose of installing the required equipment, including site plans that show
- (i) the outline and location of all significant electricity generating equipment, carbon capture equipment and compression equipment, as well as any ancillary equipment necessary, sized to capture the sufficient volume of CO2 referred to in subparagraph 9(2)(c)(i) of these Regulations,
- (ii) all areas that are to be used for carrying out the construction of the capture element, and
- (iii) the point of exit of the pipeline to transport the captured CO2 emissions from the power plant to the storage site, if the captured CO2 emissions are not stored at the power plant;
- (i) the outline and location of all significant electricity generating equipment, carbon capture equipment and compression equipment, as well as any ancillary equipment necessary, sized to capture the sufficient volume of CO2 referred to in subparagraph 9(2)(c)(i) of these Regulations,
- (k) an identification of the potential risks and obstacles, based on the preferred capture technology, to the construction and operation of the capture element integrated with the unit;
- (l) a list of each environmental, safety and other approval or permit that is required for the construction or operation of the unit integrated with the capture element; and
- (m) a list of potential suppliers of equipment, materials or services that are needed for the construction and operation of the unit integrated with the capture element.
2. The following information respecting the transportation element of the carbon capture and storage system:
- (a) an identification of, and justification for, one or more preferred transport methods and routes to an appropriate geological storage site referred to in paragraph 3(b), supported by a routing map and a geographic information system (GIS) file for each method and route;
- (b) the expected location and size of pumping stations, of receipt and delivery points and of any interconnects on the pipeline for each preferred route;
- (c) an estimation of the diameter of the pipeline for each preferred route that is required to transport the sufficient volume of CO2 referred to in subparagraph 9(2)(c)(i) of these Regulations;
- (d) if applicable, a detailed description of how any tankers that are to be used to transport the captured CO2 emissions are to be obtained and, if required, commissioned and a plan detailing how any required port infrastructure for shipping the captured CO2 emissions on those tankers is to be developed;
- (e) an identification of the potential risks and obstacles, for each preferred route, to the construction and operation of the pipeline or shipping network along that route, including any surface or subsurface land use that may conflict with that construction or operation, along with an explanation of how those risks and obstacles are to be overcome ;
- (f) a list of each environmental, safety and other approval or permit that is required for the construction or operation of the transportation element; and
- (g) a list of potential suppliers of equipment, materials or services that are needed for the construction and operation of the transportation element.
3. The following information respecting the storage element of the carbon capture and storage system:
- (a) an estimation of the volume of CO2 emissions, expressed in standard m3, to be captured and stored during each calendar year and over the anticipated operating life of the unit;
- (b) an identification of one or more suitable geological sites for storage that are expected to be used to store the captured CO2 emissions, supported by a delineation of the geographical extent of each storage site and at least one study showing that the required capacity to store the sufficient volume of CO2 referred to in subparagraph 9(2)(c)(i) of these Regulations is available based on generally accepted national or international protocols for storage capacity estimation;
- (c) an identification of any requirement under federal or provincial laws for the purity of captured CO2 emissions, along with an explanation of how that requirement is to be met;
- (d) a preliminary assessment of the integrity of the storage element in preserving an impervious barrier to leakage of stored CO2 emissions and of any risk to breaching that integrity, at each feasible storage site referred to in paragraph (b), along with a preliminary strategy to mitigate the risk;
- (e) a preliminary plan for measuring and verifying the volume of stored CO2 emissions and for monitoring any leak of the stored CO2 emissions from the storage element;
- (f) an identification of any surface or subsurface land use that may conflict with the operation of the storage element at each feasible storage site referred to in paragraph (b), along with an explanation of how the conflict is to be resolved in order to ensure access to each of those sites;
- (g) a list of each environmental, safety and other approval or permit that is required for the construction or operation of the storage element; and
- (h) a list of potential suppliers of equipment, materials or services that are needed for the construction and operation of the storage element for each feasible site referred to in paragraph (b).
SCHEDULE 3
(Paragraphs 9(2)(d) and 11(1)(b))
INFORMATION ON SECTION 10 REQUIREMENTS
1. If a front end engineering design study referred to in paragraph 10(a) of these Regulations has been carried out, the following information to summarize that study:
- (a) an overall description of the construction project for the carbon capture and storage system, including technical drawings and documents that describe
- (i) the configuration and layout of the power plant in which the unit is located when it is operating with an integrated capture element of the system,
- (ii) the transportation element of the system, and
- (iii) the site of the storage element of the system;
- (i) the configuration and layout of the power plant in which the unit is located when it is operating with an integrated capture element of the system,
- (b) an estimate of capital cost of the construction project, including a summary of the analysis that led to that estimate and a justification for the margin of error of that estimate;
- (c) a summary of the safety review of the capture element of the carbon capture and storage system;
- (d) a summary of the risk assessment of the carbon capture and storage system;
- (e) a summary of the strategy to mitigate those risks;
- (f) a summary of the plan to carry out the construction of the carbon capture and storage system, including a schedule for the completion of its major steps;
- (g) an identification of potential persons with whom agreements can be entered into to carry out the construction of the carbon capture and storage system;
- (h) the name and business address of the persons responsible for the development of the front end engineering design study and a description of their contribution to its development;
- (i) a description of the capture technology selected in the front end engineering design study for the capture element of the carbon capture and storage system and of the capture element’s integration with the unit;
- (j) an identification of any major equipment required to be purchased for the construction of the capture element of the carbon capture and storage system;
- (k) an estimate of the performance of the unit when it is operating with an integrated carbon capture and storage system, supported by process flow diagrams and mass and energy balances, including an estimate of
- (i) the rate of capture of CO2 emissions and the volume of CO2 emissions, expressed in standard m3, to be captured for a calendar year and for the operating life of the unit,
- (ii) the production capacity of the unit,
- (iii) the unit’s gross quantity of electricity produced for a calendar year — as set out in the description of Ggross in subsection 19(1) of these Regulations — when it is operating with an integrated capture element,
- (iv) a summary of auxiliary energy loads,
- (v) the period during a calendar year during which a unit is expected to be available for producing electricity, and
- (vi) for a calendar year, the quantity of CO2 emissions from the combustion of fossil fuels in the unit and the quantity of emissions of nitrogen oxides, sulphur oxides, particulate matter, mercury and, if applicable, ammonia from the unit; and
- (i) the rate of capture of CO2 emissions and the volume of CO2 emissions, expressed in standard m3, to be captured for a calendar year and for the operating life of the unit,
- (l) a summary of the resource analysis for the unit when it is operating with an integrated capture element of the carbon capture and storage system, including water consumption, heat and power consumption, raw material consumption and fuel consumption.
2. If any major equipment that is necessary for the capture element referred to in paragraph 10(b) of these Regulations has been purchased, a copy of the purchase orders and receipts respecting the purchase of that equipment.
3. A declaration, signed by all contracting parties to any contract referred to in paragraph 10(c) of these Regulations, that indicates that the contract has been entered into and the date on which it was entered into.
4. A copy of any permit or approval referred to in paragraph 10(d) that has been obtained.
5. A declaration — signed by the responsible person and, if applicable, any party contracting with the responsible person for the capture, transportation or storage elements of the carbon capture and storage system — that indicates the date on which CO2 emissions from the combustion of fossil fuels in the unit have been captured in accordance with the laws of Canada or a province that regulate that capture and have been transported and stored in accordance with the laws of Canada or a province, or of the United States or one of its states, that regulate that transportation or storage, as the case may be.
SCHEDULE 4
(Section 15)
ANNUAL REPORT — INFORMATION REQUIRED
1. The following information respecting the responsible person:
- (a) an indication of whether they are the owner or operator of the unit and their name and civic address;
- (b) the name, title, civic and postal addresses, telephone number and, if any, email address and fax number, of their authorized official; and
- (c) the name, title, civic and postal addresses, telephone number and, if any, email address and fax number, of a contact person, if different from the authorized official.
2. The following information respecting the unit:
- (a) for each responsible person for the unit, other than the responsible person mentioned in paragraph 1(a), if any
- (i) their name and civic address,
- (ii) an indication of whether they are an owner or operator, and
- (iii) in the case of an owner, their percentage of ownership interest;
- (i) their name and civic address,
- (b) its name and civic address, if any;
- (c) its registration number and, if applicable, its National Pollutant Release Inventory identification number assigned by the Minister for the purpose of section 48 of the Act;
- (d) if applicable, the number of other units located at the power plant in which the unit is located and, for each of those other units, the information referred to in paragraph (a); and
- (e) if applicable, a statement that indicates that the unit shares a common stack with one or more of those other units, along with a statement that identifies each of those other units.
3. The following information respecting the emission-intensity referred to in subsection 3(1) of these Regulations from the combustion of fuel in the unit — other than a unit referred to in paragraph 4(d) — during the calendar year:
- (a) the emission-intensity for the unit, namely the ratio of the quantity of CO2 emissions referred to in paragraph (c) to the quantity of electricity referred to in subparagraph (b)(i), expressed in tonnes per GWh;
- (b) in respect of the quantity of electricity produced by the unit
- (i) that quantity determined in accordance with section 19 of these Regulations, expressed in GWh,
- (ii) the value determined for Ggross and Gaux in the formula set out in subsection 19(1) of these Regulations, expressed in GWh,
- (iii) the gross electricity produced by the units located at the power plant for the calendar year, namely the sum of the value determined for Ggross referred to in subparagraph (ii) and of the gross electricity produced by all other units located at the power plant determined in accordance with that description of Ggross,
- (iv) the quantity of electricity, expressed in GWh, that is used by the power plant in which the unit is located during the calendar year to operate infrastructure and equipment for electricity generation and for separation, but not pressurization, of CO2, based on data collected using meters that comply with the requirements of the Electricity and Gas Inspection Act and the Electricity and Gas Inspection Regulations,
- (v) if that calendar year is the calendar year referred to in subsection 19(2) of these Regulations for which a method of attribution was first used, a detailed description of that method of attribution and an explanation of why it is appropriate, and
- (vi) if that calendar year is a subsequent calendar year referred to in subsection 19(3) of these Regulations, a detailed description of the method of attribution referred to in that subsection used for that subsequent calendar year and an explanation of why it is appropriate;
- (i) that quantity determined in accordance with section 19 of these Regulations, expressed in GWh,
- (c) in respect of the quantity of CO2 emissions from the combustion of fuels in the unit,
- (i) if paragraph 20(1)(a) of these Regulations applies for the determination of that quantity,
- (A) that quantity, expressed in tonnes, determined in accordance with section 21 of these Regulations,
- (B) the values, expressed in tonnes, determined for Eu, Ebio and Enon-ccs in the formula set out in subsection 21(1) of these Regulations,
- (C) a statement that indicates which of paragraphs (a) and (b) of the description of that Ebio was used to determine the value of that element, and
- (D) the value, expressed in tonnes, determined for Es in the formula set out in subparagraph 21(2)(d)(ii) of these Regulations, and
- (A) that quantity, expressed in tonnes, determined in accordance with section 21 of these Regulations,
- (ii) if paragraph 20(1)(b) of these Regulations applies for the determination of that quantity,
- (A) that quantity, expressed in tonnes, determined in accordance with section 22 of these Regulations and, as the case may be, section 23 or 24 of these Regulations,
- (B) the values, expressed in tonnes, determined for Ei for each fuel combusted, and for Eccs, in the formula in section 22 of these Regulations,
- (C) the value, expressed in tonnes, determined for Es in the formula set out in subparagraph 21(2)(d)(ii) of these Regulations,
- (D) a statement for each fuel combusted that indicates which of section 23 and 24 of these Regulations was used to determine the quantity referred to in clause (A),
- (E) if that quantity was determined in accordance with section 23 of these Regulations,
- (I) the value of CCA in the formula set out in paragraph 23(1)(a), (b) or (c) of these Regulations, as the case may be, for each fuel combusted, and
- (II) a statement that indicates which of the ASTM standards and of the methods referred to in the description of CCi in the formula in subsection 23(2) of these Regulations were used to determine the value of CCA referred to in subclause (I) or, for a sample of gaseous fuel, that indicates that a direct measuring device was used to determine that value, and
- (I) the value of CCA in the formula set out in paragraph 23(1)(a), (b) or (c) of these Regulations, as the case may be, for each fuel combusted, and
- (F) if that quantity was determined in accordance with section 24 of these Regulations,
- (I) for each fuel combusted,
- 1. its type,
- 2. a statement that indicates which of paragraphs 24(2)(a) to (d) of these Regulations describes the fuel, and
- 3. in the case of a fuel described by paragraph 24(2)(b) of these Regulations, the average daily rate at which the fuel was combusted,
- (II) if paragraph 24(1)(a) of these Regulations applies,
- 1. the value of HHV, as described in paragraph (a) of that element, in the formula set out in subsection 24(4) of these Regulations, for each fuel combusted,
- 2. if the fuel’s type is set out in column 1 of the applicable table to Schedule 5, its default CO2 emission factor as set out in column 3 and, if that fuel’s type is not so set out, the default CO2 emission factor for that fuel’s type established by a body that is internationally recognized as being competent to establish default CO2 emission factors for fuels and a statement that indicates the name of the body, and
- 3. a statement that indicates which of the ASTM and GPA standards and of the methods referred to in subsection 24(6) of these Regulations were used to determine the measured value of HHV referred to in sub-subclause 1 or, for a gaseous fuel, that indicates that a direct measuring device was used to determine that measured value, and
- (III) if paragraph 24(1)(b) of these Regulations applies
- 1. the default value of HHV, as described in paragraph (b) of that element, in the formula set out in subsection 24(4) of these Regulations, for each fuel combusted,
- 2. a statement that explains the absence of a measured higher heating value and that indicates, if that default higher heating value is established by a body that is internationally recognized as being competent to establish default higher heating values for fuels, the name of the body, and
- 3. if the fuel’s type is set out in column 1 of the applicable table to Schedule 5, its default CO2 emission factor as set out in column 3 and, if that fuel’s type is not so set out, the default CO2 emission factor for that fuel’s type established by a body that is internationally recognized as being competent to establish default CO2 emission factors for fuels and a statement that indicates the name of the body;
- (A) that quantity, expressed in tonnes, determined in accordance with section 22 of these Regulations and, as the case may be, section 23 or 24 of these Regulations,
- (i) if paragraph 20(1)(a) of these Regulations applies for the determination of that quantity,
- (d) if applicable, documents that establish that the captured CO2 emissions were captured, transported and stored as described in subsection 3(5) of these Regulations;
- (e) if applicable, the quantity of CO2 emissions that were captured, determined using a direct measure of the flow of, and the concentration of CO2 in, those emissions; and
- (f) for each type of fuel combusted,
- (i) the type and, if that type is biomass, an explanation of why that type is biomass as defined in subsection 2(1) of these Regulations, and
- (ii) the quantity of fuel combusted.
- (i) the type and, if that type is biomass, an explanation of why that type is biomass as defined in subsection 2(1) of these Regulations, and
4. Information for the calendar year respecting
- (a) the number of hours during which the unit produced electricity;
- (b) if a substituted unit referred to in subsection 5(1) of these Regulations has been substituted for an original unit, the production capacity of that substituted unit;
- (c) for a standby unit, the capacity factor for the standby unit;
(d) for a unit granted an exemption under subsection 7(4) of these Regulations,- (i) the emergency period for the calendar year, namely, the period that begins on the first day in the calendar year on which the emergency existed and that ends on the last day in the calendar year on which it existed,
- (ii) the number of hours in the emergency period during which the unit operated, and
- (iii) the information referred to in item 3 for each emergency period for, and any other period of, the calendar year; and
- (i) the emergency period for the calendar year, namely, the period that begins on the first day in the calendar year on which the emergency existed and that ends on the last day in the calendar year on which it existed,
- (e) for an existing unit referred to in subsection 14(4) of these Regulations, the percentage of CO2 emissions from the unit that are captured, transported and stored, along with supporting documents to establish the validity of that percentage.
5. A copy of the auditor’s report referred to in subsection 26(4) of these Regulations.
6. If replacement data referred to in section 28 of these Regulations was used for a day or days for a given period referred to in subsection 28(1) of these Regulations during the calendar year,
- (a) the reason for which data required to determine the value of an element of a formula set out in section 19 or any of sections 21 to 24 of these Regulations was not obtained and an explanation as to why that reason was out of the control of the responsible person;
- (b) the element of the formula for which data was not obtained and the date of the day on which the data was not obtained and, if that data was not obtained for a period of several days, the dates of the days on which the period begins and ends; and
- (c) the value determined for that element using replacement data, along with details of that determination, including
- (i) the data used to make that determination for each period of one or several days,
- (ii) the method used to obtain that data, and
- (iii) in the case of a determination of the value of an element referred to in subsection 28(3) of these Regulations for a given period, a justification for the given period being used as the basis of that determination.
- (i) the data used to make that determination for each period of one or several days,
SCHEDULE 5
(Paragraphs 21 (2)(b) and 24 (1)(b) and (2)(c) and Subsection 24(4))
LIST OF FUELS
TABLE 1
SOLID FUELS
Item |
Column 1 |
Column 2 |
Column 3 |
|---|---|---|---|
1. |
Bituminous Canadian coal – Western |
25.6 |
86.1 |
2. |
Bituminous Canadian coal – Eastern |
27.9 |
82.1 |
3. |
Bituminous non-Canadian coal – U.S. |
25.7 |
95.6 |
4. |
Bituminous non-Canadian coal – Other Countries |
29.9 |
85.2 |
5. |
Sub-bituminous Canadian coal – Western |
19.2 |
89.9 |
6. |
Sub-bituminous non-Canadian coal – U.S. |
19.2 |
95.0 |
7. |
Coal – lignite |
15.0 |
92.7 |
8. |
Coal – anthracite |
27.7 |
86.3 |
9. |
Coal coke and metallurgical coke |
28.8 |
86.0 |
10. |
Petroleum coke from refineries |
46.4 |
82.3 |
11. |
Petroleum coke from upgraders |
40.6 |
86.1 |
12. |
Municipal solid waste |
11.5 |
86.0 |
13. |
Tires |
31.2 |
81.5 |
14. |
Wood and wood waste |
19.0 |
88.0 |
15. |
Agricultural byproducts |
17.0 |
112.0 |
16. |
Peat (see footnote 4) |
9.3 |
106.0 |
TABLE 2
LIQUID FUELS
Item |
Column 1 |
Column 2 |
Column 3 |
|---|---|---|---|
1. |
Diesel |
38.3 |
69.5 |
2. |
Light fuel oil |
38.8 |
70.2 |
3. |
Heavy fuel oil |
42.5 |
73.5 |
4. |
Ethanol |
21.0 |
64.9 |
TABLE 3
GASEOUS FUELS
Item |
Column 1 |
Column 2 |
Column 3 |
|---|---|---|---|
1. |
Biogas (captured methane) |
0.0281 |
49.4 |
TABLE 4
LIST OF FUELS FOR THE PURPOSE OF SUBSECTION 24(2)
Item |
Column 1 |
Column 2 |
Column 3 |
|---|---|---|---|
1. |
Distillate fuel oil No.1 |
38.78 |
69.37 |
2. |
Distillate fuel oil No. 2 |
38.50 |
70.05 |
3. |
Distillate fuel oil No. 4 |
40.73 |
71.07 |
4. |
Kerosene |
37.68 |
67.25 |
5. |
Liquefied petroleum gases (LPG) |
25.66 |
59.65 |
6. |
Propane (pure, not mixtures of LPGs)(see footnote 6) |
25.31 |
59.66 |
7. |
Propylene |
25.39 |
62.46 |
8. |
Ethane |
17.22 |
56.68 |
9. |
Ethylene |
27.90 |
63.86 |
10. |
Isobutane |
27.06 |
61.48 |
11. |
Isobutylene |
28.73 |
64.16 |
12. |
Butane |
28.44 |
60.83 |
13. |
Butylene |
28.73 |
64.15 |
14. |
Natural gasoline |
30.69 |
63.29 |
15. |
Motor gasoline |
34.87 |
65.40 |
16. |
Aviation gasoline |
33.52 |
69.87 |
17. |
Kerosene-type aviation |
37.66 |
68.40 |
18. |
Pipeline quality natural gas |
0.03793 |
50.12 |
SCHEDULE 6
(Subsection 26(4))
AUDITOR’S REPORT — INFORMATION REQUIRED
1. The name, civic address and telephone number of the responsible person.
2. The name, civic address, telephone number and qualifications of the auditor and, if any, the auditor’s fax number and email address.
3. The procedures followed by the auditor to assess whether
- (a) the responsible person’s use of the CEMS complied with the Quality Assurance/Quality Control manual referred to in section 6 of the Reference Method; and
- (b) the responsible person complied with the Reference Method and the CEMS meets the specifications set out in the Reference Method, in particular, in its sections 3 and 4.
4. A declaration of the auditor’s opinion as to whether
- (a) the responsible person’s use of the CEMS complied with the Quality Assurance/Quality Control Manual referred to in section 6 of the Reference Method; and
- (b) the responsible person complied with the Reference Method and the CEMS has met the specifications set out in the Reference Method, in particular, in its sections 3 and 4.
5. A statement of the auditor’s opinion as to whether the responsible person has ensured that the Quality Assurance/Quality Control manual was updated in accordance with sections 6.1 and 6.5.2 of the Reference Method.
REGULATORY IMPACT ANALYSIS STATEMENT
(This statement is not part of the Regulations.)
1. Executive summary
Issue: Greenhouse gases (GHGs) contribute to climate change and the most significant source of anthropogenic GHG emissions is the combustion of fossil fuels. The emissions of GHGs have been increasing significantly since the industrial revolution and this trend is likely to continue if no action is taken.
In December 2009, the Government of Canada committed to a national greenhouse gas reduction target of 17% below 2005 levels by 2020, and inscribed this in the Copenhagen Accord. The 2020 target is aligned with that of Canada’s largest trading partner, the United States (U.S.).
To achieve its target, the Government of Canada has established a comprehensive plan to reduce GHG emissions in all major emitting sectors, on a sector-by-sector basis. In moving forward with this plan, the Government of Canada published the proposed Reduction of Carbon Dioxide Emissions from Coal-fired Generation of Electricity Regulations on August 27, 2011 (Canada Gazette, Part Ⅰ [CGI], Vol. 145, No. 35).
In 2010, the latest year of emissions data available under Canada’s National Inventory Report (NIR) under the United Nations Framework Convention on Climate Change (UNFCCC), total GHG emissions were about 6% (48 megatonnes [Mt]) below 2005 levels.
In the same year, GHG emissions from the electricity generation sector represented around 15% (101 Mt) of Canada’s total emissions. (see footnote 8) Coal-fired electricity generation, which represents only 15% of total electricity generation, was responsible for 77 Mt of GHG emissions in Canada, about 77% of total electricity sector emissions.
These Regulations addressing coal-fired electricity generation are a key part of meeting the Government of Canada’s 2020 commitments under the Copenhagen Accord and ensuring that investments in new electricity generation infrastructure support long-term GHG emission reduction goals.
Description: The Reduction of Carbon Dioxide Emissions from Coal-fired Generation of Electricity Regulations (the Regulations) will set a stringent performance standard for new coal-fired electricity generation units and those that have reached the end of their useful life. The level of the performance standard will be fixed at 420 tonnes of carbon dioxide per gigawatt hour (CO2/GWh). This approach will implement a permanent shift to lower- or non-emitting types of generation, such as high-efficiency natural gas, renewable energy, or fossil fuel-fired power with carbon capture and storage (CCS).
The performance standard of the Regulations will come into effect on July 1, 2015. Regulated entities will be subject to enforcement and compliance requirements and penalties as specified under the Canadian EnvironmentalProtection Act, 1999 (CEPA 1999).
The Government’s approach to addressing climate change is based on the principle of maximizing environmental performance improvements while minimizing adverse economic impacts. The electricity industry is facing major capital stock turnover. A number of electricity generation facilities are reaching the end of their useful lives, and regulatory uncertainty would impede investments in new generation capacity. These Regulations provide industry with the certainty needed to make the necessary investments to continue to meet the growing need for electricity generation given projected economic growth, while at the same time delivering significant reductions in GHG emissions by regulating the phase-in of lower-emitting sources of generation.
The Regulations are designed to minimize stranded capital by targeting the point of capital stock turnover. For example, in the absence of regulations now, industry may build new standard coal-fired units to replace those due to retire in the coming years, and as a result would face much higher costs to reduce GHG emissions under potential, future regulations.
Consultation: Since publication of the Regulations in CGI, the Government has received a significant number of comments and has undertaken extensive consultations on both the details of the Regulations and the economic analysis. Overall, support was expressed for the proposed regulated performance standard but concerns were raised regarding the impact on specific units, or alignment with existing provincial regulatory programs. Among the non-governmental organizations (NGOs) consulted, some had questions regarding the regulatory approach in terms of the impact on GHG emission reductions. As well, significant changes to the underlying economic analysis were made as a result of productive consultations with provinces. This Regulatory Impact Analysis Statement (RIAS) outlines the final regulatory provisions, the updated cost-benefit analysis (CBA) that is a result of these consultations, and the Government’s responses to major comments received.
Cost-benefit statement: The Regulations are estimated to result in a net reduction of approximately 214 Mt CO2e of GHG emissions over the period 2015–2035. The Regulations result in significant climate change and air quality benefits; the present value of the benefits in 2015 is estimated at $23.3 billion, due in part to the avoided costs of climate change of $5.6 billion, avoided generation costs of $7.2 billion, and health benefits of $4.2 billion from reduced smog exposure associated with reduced risk of death, avoided emergency room visits and hospitalization for respiratory or cardiovascular problems. The analysis also assumes that the Regulations will spur investments in fossil fuel-fired power with carbon capture and storage (CCS) technology. Where the captured CO2 is used for enhanced oil recovery (EOR) an additional net benefit of $4.7 billion is expected as a result of incremental oil production.
The present value of the costs of the Regulations in 2015 is estimated at $16.1 billion, largely due to the increased use of natural gas for fuel ($8.0 billion), reduced net exports of electricity ($0.3 billion), and incremental capital costs ($1.9 billion). The net present value (NPV) of the Regulations in 2015 is estimated at $7.3 billion (i.e. the benefits of the Regulations outweigh the costs by a margin of $7.3 billion). (see footnote 9)
The sensitivity analysis shows that the costs and benefits are sensitive to key variables such as fuel prices and the discount rate. However, under all the sensitivities that were analyzed, the NPV remained positive with the Regulations generating a net benefit. The results of the analysis are expressed in 2010 dollars and are discounted at 3% after 2015, when the Regulations take effect.
Distributional analysis: The largest GHG reductions from the utility sector are expected in Alberta (160 Mt), followed by Saskatchewan (45 Mt) and Nova Scotia (15 Mt). Avoided costs of climate change associated with provincial reductions are as follows: $4.1 billion in Alberta; $1.1 billion in Saskatchewan; and $0.4 billion in Nova Scotia.
The largest improvements in air quality from reduced smog exposure are expected to occur in Alberta and Saskatchewan, providing significant human health benefits to residents of those provinces of $2.7 billion in Alberta, and $0.6 billion in Saskatchewan. The net benefits associated with EOR of $4.7 billion occur completely within Saskatchewan.
The distribution of net cost impacts is similar to the distribution of benefits across provinces. Alberta is expected to incur the largest increase in net generation costs ($5.9 billion), followed by Saskatchewan ($1.2 billion). Minimal impacts are expected in other provinces and territories.
Business and consumer impacts: Electricity prices in Canada are expected to increase in the future with or without the regulatory performance standard due to a shift towards natural gas. The Regulations are expected to have a very limited impact on gross domestic product (GDP), as the effects of slightly higher costs in electricity generation are offset by new oil production through enhanced oil recovery. For individual Canadians, the Regulations generate health and environmental benefits through improved air quality and reduced GHG emissions. The gradual phase-in of the Regulations defers most of the price effects to beyond 2020. This moderates the impact on consumers, and results in the share of household budget spent on electricity remaining relatively constant.
In the residential sector, the average annual change over the analytical period in residential electricity prices as a result of the performance standard is expected to have the greatest impacts in Alberta (1.61 cents per kilowatt hour [kWh]), Saskatchewan (0.74 cents/kWh), and Nova Scotia (0.76 cents/kWh). It is expected that the price increases from the Regulations will be passed on to consumers in proportion to their consumption. Households that consume more (or less) than the average would pay proportionately more (or less) of the total costs.
The Regulations will also have a similar impact on electricity prices in the industrial sector with average annual changes in electricity prices of 1.61 cents/kWh in Alberta, 0.82 cents/kWh in Saskatchewan, and 0.76 cents/kWh in Nova Scotia. These incremental price increases are not expected to have significant impacts on the industrial sector in Canada. In general, Canada has low electricity rates relative to many of its global competitors, and long-term trends continue to show that the sector is using less energy for each unit of economic output.
Domestic and international coordination and cooperation: The Regulations will help move Canada towards the Government’s stated commitment to reduce GHG emissions to 17% below 2005 levels by 2020, which was inscribed in the Copenhagen Accord and is in alignment with the U.S. target. It also produces significant longer-term emissions reductions, supporting global action to reduce GHG emissions. Impacts on international trade agreements are not expected, and within the domestic market, the Regulations reinforce the significant commitments that have already been made by provinces (in particular, Ontario and Nova Scotia) to reduce emissions from coal-fired electricity generation.
Further, the Government of Canada is following an approach to climate change that is broadly aligned with that of the U.S. The U.S. Environmental Protection Agency (EPA) recently released a GHG performance standard that covers new power plants. It also has a permitting process in place for new and modified facilities that can establish even more stringent limits. Finally, while U.S. GHG requirements do not address existing coal-fired electricity plants, the EPA has finalized stringent air pollutant requirements for these plants.
2. Background
The Government has made a commitment, inscribed in the Copenhagen Accord, to reduce domestic greenhouse gas (GHG) emissions by 17% from their 2005 level by 2020. In the 2010 Speech from the Throne, the Government of Canada committed to continuing to take steps to fight climate change by leading the world in clean electricity generation, and reiterated this support for clean energy projects in the 2011 Speech.
The Government of Canada’s approach to addressing climate change is to follow a sector-by-sector regulatory plan to reduce emissions. These Regulations addressing coal-fired electricity generation are a key part of that plan. The Government’s approach is designed to achieve both environmental and economic objectives. Given the highly integrated North American economy, the Government of Canada has followed an approach to address climate change that is broadly aligned with that of the United States.
Environment Canada first announced its intention to reduce GHG emissions in the electricity sector on June 23, 2010. On August 27, 2011, the Government of Canada published proposed Regulations in the Canada Gazette, Part Ⅰ. The proposed regulatory approach applied a stringent performance standard to new coal-fired units and units that have reached the end of their useful life. At the same time it took into account the unique circumstances of individual provinces and specific industry units in order to maintain Canadian competitiveness while achieving real reductions in GHGs.
Publication of the proposed Regulations in CGI initiated a 60-day comment period. Over 5 000 submissions were received during this time, including submissions from 4 provincial governments, 16 electricity industry corporations or system operators, 17 other industry corporations or associations, and 6 NGOs. The remainder of comments came from the general public, primarily through the use of form letters available on various Web sites. Based on these comments and extensive discussions with industry and provinces, certain refinements have been implemented for the Regulations. These refinements provide some greater flexibility to industry, while respecting the CGI regulatory framework and maintaining the contribution of the Regulations to Canada’s Copenhagen target.
3. Issue
Greenhouse gases contribute to climate change and the most significant source of anthropogenic GHG emissions is the combustion of fossil fuels. The emissions of GHGs have been increasing significantly since the industrial revolution and this trend is likely to continue if no action is taken.
Looking to the latest year of emissions data available under Canada’s National Inventory Report under the UNFCCC, Canadian emissions of GHGs in 2010 were about 6% below 2005 levels (48 Mt). In 2010, GHG emissions from the electricity generation sector contributed around 15% (101 Mt) to Canada’s inventory of emissions. Coal-based electricity, which represents 15% of total electricity generation in Canada, was responsible for 77 Mt of GHG emissions, about 77% of total electricity sector emissions.
The electricity industry is facing major capital stock turnover decisions and major new investments are inevitable over the coming years. As of January 2012, there are 45 operating coal units in Canada. However, nearly two thirds of Canada’s coal-fired electricity generation present in 2010 — some 28 coal-fired units — are forecasted to cease operations by 2025. Regulatory certainty with respect to emissions requirements from electricity generation will facilitate investments in new, low- or non-emitting generation facilities at a low incremental cost, and at the same time ensure that investment decisions do not lead to stranded assets in the future. For example, in the absence of regulations now, industry may build new standard coal-fired units to replace those due to retire in the coming years, and as a result would face much higher costs to reduce GHG emissions under potential future regulations.
4. Objectives
The Government’s approach to addressing climate change is based on the principle of maximizing environmental performance improvements while minimizing adverse economic impacts. In 2005, Canada’s total GHG emissions were 740 Mt, representing about 2% of global GHG emissions. The Government of Canada is committed to reducing Canada’s total GHG emissions to 17% below its 2005 levels by 2020, a target that is inscribed in the Copenhagen Accord and aligned with that of the United States. Federal and provincial policies to date and the impact of the coal-fired electricity Regulations will contribute to 25% of the reductions required to meet Canada’s 2020 target.
The Government of Canada is also following an approach to climate change that is broadly aligned with that of the U.S. The U.S. EPA has introduced GHG and air pollutant rules that industry analysts expect will result in the closure of a significant number of their oldest coal-fired units (see section 11 for more details).
To secure the reductions in emissions from electricity generation in support of Canada’s target, the Government is publishing the Reduction of Carbon Dioxide Emissions from Coal-fired Generation of Electricity Regulations. The objective of the Regulations is to ensure a permanent transition from high-emitting coal-fired electricity generation to low- or non-emitting generation such as renewable energy, high-efficiency natural gas, or thermal power with carbon capture and storage (CCS).
5. Description
5.1 The Regulations
The Regulations, made under CEPA 1999, will apply a performance standard to new coal-fired electricity generation units and to old units that have reached the end of their useful life. The performance standard element of the Regulations will come into effect on July 1, 2015. This ensures that no new high-emitting coal-fired electricity units will be built in Canada.
Under the Regulations, the performance standard is set at the emissions intensity level with consideration of natural gas combined cycle technology — a high-efficiency type of natural gas generation — and will be fixed at 420 tonnes of CO2/GWh. The standard will address emissions of CO2 from the combustion of coal, coal derivatives (e.g. syngas) and petroleum coke (petcoke), and from all fuels burned in conjunction with any of the preceding fuel, except for biomass.
The Regulations address only CO2 because GHG emissions from the electricity sector, including coal-fired electricity generation, are approximately 98% CO2.
The performance standard will be applied to new and old coal-fired electricity generation units. Under the Regulations, new units are those which start producing electricity commercially on or after July 1, 2015. Old units are, in general, those units that have reached 50 years since starting to produce electricity commercially. However, as a transition measure, old units that were commissioned
- before 1975 will reach their end-of-life after 50 years of operation or at the end of 2019, whichever comes earlier; and
- after 1974 but before 1986 will reach their end-of-life after 50 years of operation or at the end of 2029, whichever comes earlier.
Flexibilities will be made available to ensure the integrity of the electricity system, all the while maintaining environmental objectives of emission reductions. These flexibilities are available through application and are subject to ministerial approval. In particular, these flexibilities include the following components:
- New and old units will be able to apply for a temporary deferral until January 1, 2025, from the application of the performance standard if they incorporate technology for CCS. Units that are granted this deferral must meet a number of regulated implementation/construction milestones and submit implementation reports on progress made with respect to these milestones.
- Existing units that employ CCS technology before they are required to meet the performance standard will be able to transfer a two-year deferral from the performance standard to old units in recognition for early action.
- Through the substitution provision, existing units that permanently shut down or meet the performance standard early can transfer a deferral to an old unit.
- An exemption to meeting the performance standard under emergency circumstances will be available where there is a disruption, or a significant risk of disruption, to the electricity supply.
Of the above described elements of these Regulations, the following notable areas were revised based on comments received after the publication of the proposed Regulations in CGI:
- The level of the performance standard was raised from the proposed 375 tonnes of CO2/GWh to 420 tonnes/GWh.
- The definition of useful life was revised to include a phased-in approach based on the unit’s commissioning date, where previously in CGI this definition included consideration of Power Purchase Arrangements (PPAs).
- The regulated milestones for the carbon capture and storage deferral are now the same for both new and old units.
- Existing units that begin capturing before they are required to can transfer an additional six months more than what was proposed in CGI to an old unit in recognition for early action.
- The substitution provision was broadened to recognize existing units that shut down prior to being subject to the performance standard.
In addition, these Regulations no longer require regulatees to report for the two years prior to when the unit would reach their end of useful life and have to meet the performance standard. This amendment significantly reduces the administrative burden of these Regulations, particularly for those units that intend to close prior to when the performance standard would apply to them.
In their entirety, the Regulations are designed to
- Require a stringent performance standard that units must meet, which encourages investment in cleaner forms of electricity generation;
- Provide flexibility in not specifying a technology or fuel that must be used, thus allowing for innovation and technology development, which will drive down costs of implementing the standard;
- Take advantage of existing anticipated capital stock turnover cycles in order to ensure that new investments do not strand existing capital, again helping to minimize costs; and
- Limit costs through a gradual application over time, in line with when units reach their end of useful life and utilities have recovered their initial investment costs.
5.2 Electricity sector
The Regulations focus on coal-fired electricity generation in Canada. To assist in understanding the scope and impacts of the Regulations, the following analysis provides a profile of Canada’s electricity generation sector and the place of coal-fired generation within it. It also examines some of the key features of the sector relating to generation capacity and fuel mix, interprovincial and international electricity flows, and electricity demand, all of which will have a bearing on the assessment of the impacts of the Regulations.
5.2.1 Electricity generators
The Canadian electricity generation industry is composed of utility and non-utility generators that produce electricity by transforming the energy in water, coal, natural gas, refined petroleum products, miscellaneous other fuels, biomass, nuclear, wind and solar resources into energy. The process of supplying electricity to the public involves not only power generation at the plant, but also distribution through the electricity grid.
Overall, electricity generation in 2010 was 542 900 GWh, a decrease of about 2% from the 556 500 GWh observed in 2005. In 2010, hydroelectric power produced 59% of Canada’s total electricity, followed by nuclear (16%), coal (15%), and natural gas (7%), while refined petroleum products (RPPs), other fuels, and other sources such as wind and bioenergy accounted for the remainder (3%).
Internationally, Canada has a relatively low GHG intensity for producing electricity due to approximately 75% of the generation mix coming from non-emitting sources (see Table 1). In comparison, the U.S. has a much higher intensity due to its predominately fossil fuel-oriented system.
5.2.2 Regional trends — Generation and Source
The trends reported below (see footnote 10) are based on utility generators, which represent about 92% of total generation (the remainder are non-utility generators, which do not directly serve the public — they generate electricity for their own end-use or for sale in wholesale markets). Coal-fired electricity generation currently does not represent any of the non-utility combustion-generation mix.
Figure 1 provides a breakdown of electricity generation by region and by source for the years 2005 and 2010. Coal-fired electricity sources are more significant in Alberta and Saskatchewan, due to access to abundant coal resources. Hydro provides the majority of electricity generation in the provinces of Quebec, British Columbia, Manitoba, and Newfoundland and Labrador. In Ontario and the Atlantic region, the electricity generation mix is fairly diverse, with nuclear power providing the greatest percentage of the supply in Ontario. In terms of total generation, Quebec and Ontario have by far the highest generation totals — combined, they produced 316 500 GWh (59%) of Canada’s electricity supply in 2010. They are followed by Alberta (about 57 200 GWh) and British Columbia (about 48 200 GWh), then by Newfoundland and Labrador (40 500 GWh).
Figure 1: Electricity Generation by Region and Source, 2005 and 2010
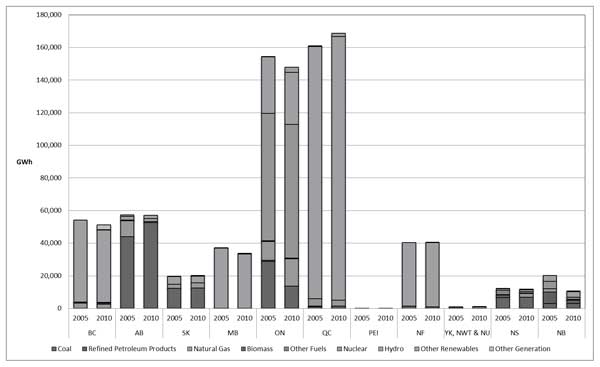
Overall, national electricity generation has decreased since 2005; however, electricity generation has increased since 2005 in some provinces, such as Saskatchewan (3%) with expanded use of coal and natural gas, and Quebec (5%) with expanded hydro generation, biomass, and other renewables. In Manitoba, a 9% decrease coincided with reductions in coal and hydro generation and increases in other renewable generation, while in Ontario, a 4% decrease in generation coincided with increased nuclear power, and a significant increase in the use of natural gas and other renewable generation. There was also a reduction in generation from coal, refined petroleum products, and hydro. In British Columbia, electricity generated decreased by 11%, which coincided with less hydro generation and less natural gas generation.
5.2.3 Electricity trade flows
Although imports and exports of electricity together represent a very small fraction of total generation, the interconnectedness of the electricity grid with the U.S., combined with varying requirements in different regions of the country, allows the import and export of electricity in response to demand and pricing conditions on both sides of the Canada-U.S. border. As shown in Figure 2, electricity exports to the U.S. grew by 12% between 1989 and 2010, from 22 000 GWh to over 24 000 GWh, respectively. Imports from the U.S. have decreased by about 37% between 1989 and 2010.
On balance, Canada is a net exporter of electricity to the U.S. mainly due to U.S. electricity demand, additional generation capacity, and the availability of low-cost hydroelectric resources. Some regions in Canada, however, rely on imports to meet domestic load requirements during high demand periods (for example during the winter months when electricity use is high in most provinces, and relatively low in many American states) or when water levels are low in hydropower-based provinces.
Figure 2: Imports and Exports with the United States

In recent years, Canadian electricity generation has lagged behind growth in domestic demand. As a result, the surplus available for export has been declining and some regions have increasingly relied on imports to meet domestic requirements during high demand periods. Both Canada and the United States realize commercial benefits and improved electric reliability through trade, mainly due to complementary (off-set) demand peaking seasons.
5.2.4 Actual versus potential generation
Canada’s electricity-generating sector takes advantage of a full mix of hydro, nuclear, wind and other available generating sources. At the same time, actual generation from all these sources is less than potential generation. Potential generation can be determined by assuming capacity is fully operational for each hour, over the entire year. The difference between potential and actual generation can be due to numerous factors including the availability (or lack thereof) of precipitation and wind as well as operational considerations such as required maintenance schedules.
Table 1 shows the actual generation, potential generation and capacity utilization level for major generation types in 2008. Nuclear generation had the highest capacity utilization level in 2008, with actual generation at over 77% of full capacity. This was followed by coal and hydro generation, while other sources such as gas, oil, and wind units had relatively high levels of available spare generation capacity. Typically, coal, gas, and oil units can operate at up to 85% of their potential generation capacity. However, the relatively higher price of gas and oil generation means that it is most often called upon only to meet peak demand, particularly in regions where coal or hydro generation are used to meet base load demand. Over any period of time, actual wind generation is typically much below its full theoretical capacity given the intermittent nature of wind energy.
Table 1: Actual versus Potential Generation — 2008 (see footnote 11)
| Type | Actual Generation (GWh) | Potential Generation (GWh) | Capacity Utilization (Actual/Potential) |
|---|---|---|---|
| Hydro | 373 871 | 652 040 | 57% |
| Wind | 3 807 | 20 873 | 18% |
| Nuclear | 90 585 | 116 902 | 77% |
| Coal | 104 580 | 139 631 | 75% |
| Oil | 7 220 | 68 199 | 11% |
| Gas | 31 636 | 81 702 | 39% |
| Total | 611 699 | 1 079 347 | 57% |
5.2.5 Profile of coal plants/units
Table 2 shows the installed capacity of coal plants/units, by province as of 2010. The Canadian share of coal-fired electricity generation is the largest in Alberta (38%), followed by Ontario (37%), (see footnote 12) Saskatchewan (11%), Nova Scotia (8%), New Brunswick (5%) and Manitoba (1%). Approximately 95% of coal-fired electricity generating units reside in four provinces: Alberta, Ontario, Saskatchewan and Nova Scotia. In 2010, coal contributed to the electricity generation mix in six provinces: Alberta (92% of total generation), Nova Scotia (53%), Saskatchewan (63%), New Brunswick (29%), Ontario (9%) and Manitoba (<1%).
Table 2: Coal Generation Capacity — Year 2010 (see footnote 13)
| Region | Number of Coal Plants | Number of Coal Units |
Coal Generating Capacity (MW) |
Share of Total Coal Capacity for Canada |
|---|---|---|---|---|
| Alberta | 7 | 18 | 6 305 | 38% |
| Ontario | 4 | 15 | 6 077 | 37% |
| Saskatchewan | 3 | 9 | 1 822 | 11% |
| Manitoba | 1 | 1 | 97 | 1% |
| Nova Scotia | 4 | 8 | 1 288 | 8% |
| New Brunswick | 3 | 3 | 891 | 5% |
| Total | 22 | 54 | 16 481 | 100% |
Most of Canada’s coal-fired generation capacity is old and nearing the end of its useful life. As a result, the coal-fired generation sub-sector is expected to undergo a major transition over the next several decades. Environment Canada’s Environment Energy and Economy Model of Canada (E3MC) forecasts that 67% of total coal-fired capacity will cease operations by 2030. More specifically,
- — Between 2010 and 2025, 28 units (51% of total) are expected to cease operations;
- — By 2030, an additional 9 units (67% cumulative); and
- — By 2040, an additional 8 units (82% cumulative). (see footnote 14), (see footnote 15)
Alberta
Alberta’s coal-fired electricity generation fleet is relatively old, with 13 of 18 units present in 2010 expected to cease operations by 2035. Alberta has regulatory requirements for all of the province’s coal units; under the province’s Specified Gas Emitters Regulation, the emissions intensity of existing coal units must be reduced by 12% below the 2003–2005 baseline emissions intensity of the facilities starting in 2007.
Ontario
The Ontario government has enacted regulations requiring that by December 31, 2014, coal no longer be used in their currently operating coal units. Based on these regulations, the remaining generation stations as of 2010 at Atikokan (one unit), Lambton (four units), Nanticoke (eight units) and Thunder Bay (two units) will be closed by 2015. The closure of these coal units is part of Ontario’s commitment to fight climate change. In fact, as a result of Ontario’s decision to phase out coal-fired generation, emissions in Ontario are projected to fall significantly over the 2005–2015 period. Estimates generated by the E3MC range from 22 Mt of CO2 to 33 Mt depending on the timing of retirements.
Saskatchewan
Saskatchewan’s coal-fired capacity is aging, with four out of nine units expected to cease operations by 2035. Through recent consultations, SaskPower has indicated an intention to close two of its coal units in the near term (Boundary Dam units 1 and 2), and the Government of Saskatchewan announced on April 26, 2011, that it has approved the rebuilding of Boundary Dam unit 3 with an integrated CCS system. (see footnote 16) This will be the first commercial-scale fully integrated CCS storage facility in the world. The facility is a demonstration project between industry and the federal and provincial governments to determine the technical, economic, and environmental performance of CCS. (see footnote 17)
Nova Scotia
Nova Scotia has one out of eight units ceasing operations by 2020, and all but two closed by 2030. Nova Scotia’s 2009 Climate Change Action Plan and 2009 Energy Strategy commit the province to undertake orderly transition from dirty coal to cleaner and more sustainable energy sources. Subsequent to these, Nova Scotia’s 2010 Renewable Electricity Plan details the requirement for obtaining 25% of electricity from renewables by 2015, and proposes to increase this to 40% by 2020. Regulations have also been adopted capping the emissions from electricity producers in the province. This will result in reduced use of fossil fuels (primarily coal and petroleum coke [i.e. petcoke]).
The Government of Canada and the Province of Nova Scotia have announced that they are developing an equivalency agreement in an effort to ensure that industry does not face two sets of regulations and to allow the province to achieve equivalent emissions levels as the federal standard in a manner that is appropriate to its particular circumstances.
New Brunswick
New Brunswick had three coal-fired electricity generating units in 2010, two that are expected to cease operations before 2035 and one of which is expected to close by 2039.
Manitoba
Manitoba has only one coal-fired electricity generating unit, which is expected to cease operations in 2030. According to Manitoba’s Climate Change and Emissions Reduction Act, after December 31, 2009, Manitoba Hydro must not use coal to generate power, except to support emergency operations.
Manitoba’s Beyond Kyoto Plan also outlines the introduction of taxes on emissions from coal and provides capital support for coal-reliant industries to convert to cleaner energy and to develop biomass as a coal alternative.
5.2.6 Electricity consumers
Major consumers of electricity are shown in Table 3. The largest consuming sectors are industrial (see footnote 18) (37%), followed by residential (32%) and commercial (26%). Only a small proportion (5%) of electricity is consumed by the public administration, agriculture and transportation sectors.
Table 3: Electricity Consumption in Canada,
1990–2009 (TWh (see footnote 19)) (see footnote 20)
| Sector | Sub-sector | 1990 | 1995 | 2000 | 2005 | 2008 | 2009 |
|---|---|---|---|---|---|---|---|
| Industrial | Iron and steel | 8.3 | 8.3 | 10.3 | 10.7 | 8.7 | 6.5 |
| Chemicals | 18.2 | 19.3 | 19.2 | 19.5 | 14.7 | 12.2 | |
| Petroleum refining | 5.7 | 4.9 | 5.4 | 6.6 | 6.2 | 5.7 | |
| Aluminum and non-ferrous | 37.0 | 47.5 | 50.9 | 59.7 | 52.9 | 51.3 | |
| Mining and oil and gas extraction | 28.8 | 31.6 | 33.5 | 37.4 | 32.1 | 28.2 | |
| Other manufacturing | 34.2 | 35.3 | 42.3 | 41.1 | 42.6 | 43.0 | |
| Pulp, paper and print | 48.8 | 55.9 | 61.6 | 61.7 | 45.3 | 37.2 | |
| Cement | 1.9 | 1.9 | 2.0 | 2.0 | 2.0 | 1.4 | |
| Industrial sub-sector total | 182.9 | 204.7 | 225.2 | 238.7 | 204.5 | 185.5 | |
| Residential | 129.8 | 131.6 | 138.2 | 151.0 | 159.5 | 160.3 | |
| Commercial and institutional | 95.6 | 103.6 | 112.1 | 121.0 | 136.9 | 131.7 | |
| Others (includes transportation, agriculture, public administration) | 24.6 | 26.6 | 27.8 | 28.5 | 27.3 | 26.0 | |
| National total | 432.9 | 466.5 | 503.3 | 539.2 | 528.2 | 503.5 | |
Industrial sector
The largest industrial consumers are aluminum and non-ferrous metals, pulp and paper, mining and oil and gas, chemicals, iron and steel and petroleum refining. Other manufacturing is significant but represents a combination of industries.
Since 1990, electricity consumption has increased in two of eight industrial sub-sectors. Among other developments, the shift from a resource-based economy, the rise of the automotive and electronics sector, and the growth of the service/IT industry have all had impacts on industrial electricity consumption. More recently, seven of the eight industrial sub-sectors showed a decrease in electrical consumption relative to 2005 levels, likely a response to economic factors. During this time period, the pulp, paper and print sub-sector showed the largest decrease in electricity consumption while the “other manufacturing” sub-sector (including for example transportation, equipment, electronics, and light consumer goods) showed the largest increase.
Driven by the increase in oil sands production, industrial cogeneration capacity is expected to increase from 5 990 MW in 2010 to 7 322 MW in 2035. Industrial cogeneration capacity is expected to increase at about the same average rate as total national capacity.
Residential sector
The residential sector is a major consumer of electricity, with demand increasing by 24% between 1990 and 2009 (Table 3), largely driven by population growth and rising consumer wealth and living standards. The number of homes in Canada increased by 23% between 1990 and 2009 (the last year for which data are available), and 16% between 2000 and 2009 alone. Growth in residential electricity demand was low to moderate during the recession that occurred in the early 1990s, but consumption increased significantly with higher economic growth after 1999. Fluctuations in seasonal temperatures are an important factor, but a decidedly secondary driver of overall residential electricity demand. Due to improvements in buildings, equipment standards, and energy intensities, single-family and multi-family dwellings are expected to experience an energy intensity improvement of 11% and 13% respectively over the projection period.
Commercial sector
From 1990 to 2009, electricity consumption by the commercial sector has grown by 38% (Table 3), in part due to growth in the service and IT sectors through structural changes in Canada’s economy. This sector has also experienced an increase in the number of commercial buildings and floor space, which has meant larger areas to heat and cool, while computers, printers and other electrical appliances have become commonplace. Growth in electricity demand was particularly strong in more recent years in the commercial sector.
5.2.7 Electricity market structure
Canada’s electricity markets have primarily developed along provincial or regional boundaries, and electricity pricing varies by province or territory according to the volume and type of available generation and whether prices are market-based or regulated. Prices in most provinces and territories are set by an electricity regulator to cover costs and allow for a reasonable rate of return to investors; however, Alberta and Ontario have restructured their electricity markets.
Alberta has moved the furthest in restructuring its electricity market toward market-based pricing (retail customers have the choice of buying electricity at competitive prices from third-party sellers or at regulated prices through the local distribution utility). The price of electricity in the competitive wholesale market is determined by the offer price of the last generation unit required to meet the supply of electricity demanded in the province. System controllers observe all generator offers to the Power Pool and “stack” them from lowest to highest offer price until the supply meets the provincial demand. The majority of coal-fired generators have entered into “purchase power agreements” which establishes, terms up to the year 2020 for the generating station’s output. The owner of the “purchase power agreement” pays the generating station owner a fixed price and then sells the electricity to the retail market at the price determined by the Power Pool.
Ontario partially restructured its electricity market in 2002. Competitive wholesale prices apply to most large consumers of electricity (this market operates in a similar fashion to the Alberta wholesale market); however, after restructuring, legislation was introduced to impose price caps for low volume consumers (e.g. residential consumers), resulting in a market that is not fully competitive.
5.2.8 Carbon capture and storage
Canada is home to one of the world’s first, and still one of the world’s largest, CCS demonstration projects in Weyburn, Saskatchewan. Using CO2 to enhance the oil production from depleting oil reservoirs at Weyburn and Midale, Saskatchewan, this commercial project has been successfully demonstrating the safe underground storage of CO2 — over 16 Mt of CO2 has been injected since the start of the project. This project is also serving as a field laboratory for an international collaborative research project, launched in 2000, with the goal of developing and implementing effective and reliable CO2 measuring, monitoring and verification methodologies. As a founding member of this initiative, the federal government, along with many private and public sector partners, has been a key contributor.
In April 2011, SaskPower formally announced the incorporation of CCS technology at one of its coal-fired units. The Boundary Dam Integrated Carbon Capture and Storage Demonstration Project, a partnership involving the Government of Canada, the Government of Saskatchewan, SaskPower and private industry, will examine CCS’s economic, technical, and environmental merits. The project will be among the first commercial-scale post combustion CCS facilities in the world. The captured CO2 is expected to be used in enhanced oil recovery, while captured SO2 is expected to be used in the production of sulphuric acid and other products.
6. Regulatory and non-regulatory options considered
The Government of Canada is committed to reducing Canada’s total greenhouse gas emissions by 17% from 2005 levels by 2020. To meet this target, Canada has stated that it will proceed with strong domestic, continental and international action, including the introduction of new regulations on coal-fired electricity generation.
The Regulations to address CO2 emissions from coal-fired electricity generation are considered the most effective instrument as they provide the necessary certainty and efficiency in achieving the objective of reducing GHG emissions from the electricity generation sector. Voluntary approaches would not be able to provide assurance of significant emission reductions from this sector and the level of certainty needed to support industry investment.
Within the existing regulatory framework, two options were considered: cap-and-trade system and performance standard.
Regulatory option 1: Cap-and-trade system for the thermal electricity sector under CEPA 1999
Cap-and-trade is a policy instrument that places a mandatory cap on emissions through the distribution of emissions permits up to a pre-determined level, while providing regulated facilities with flexibility in how they will operate within the limited number of emissions permits available to them. Regulated facilities could reduce their emissions through, for example, installation of abatement technologies, changing production processes or by buying permits from sources that can abate emissions at a lower cost. Under appropriate conditions, cap-and-trade can provide high certainty in reaching an environmental objective cost effectively, while promoting new avenues for economic growth and innovation.
However, certain fundamental conditions are necessary for cap-and-trade to work effectively. First, the marginal costs of abatement across facilities must be different so that there are gains from trade and surplus permits are generated. Second, there must be a significant number of facilities to ensure the functioning of an efficient and liquid trading market. For example, the European Union Emissions Trading System (EU ETS) — the world’s first international cap-and-trade system for CO2 emissions — currently covers about 11 000 heavy energy consuming installations in power generation and manufacturing across 30 countries.
In the Canadian electricity generation sector, neither of these conditions exists to a degree which makes cap-and-trade exclusively for coal-fired electricity a viable option. The Canadian electricity system is already among the lowest-emitting in the world, with coal-fired generation representing about 15% of the total electricity produced. This means that a cap-and-trade for electricity would be targeting only 45 units of coal-fired generating units across the whole country (as of 2012), and an even smaller number of operating entities/corporations. At the same time, there are relatively small variations in marginal costs across these units, making it unlikely that many of them could generate surplus emissions permits.
These factors would lead to significant constraints on trading opportunities, which in turn would lead to low levels of market liquidity and create a risk of large fluctuations in the price of carbon permits. A fluctuating price of carbon presents a significant additional uncertainty for investors and consumers. This would make it difficult for companies to control costs and plan appropriately, and create great price uncertainty for electricity consumers. It would also limit their ability to align the construction of new facilities with normal capital investment/useful life cycles in order to achieve a smooth transition to lower-emitting fuels and/or technologies. A constrained carbon market for coal-fired generators would also be vulnerable to manipulation by one or two large facilities, a situation that is magnified in Canada by the preponderance of provincially owned utilities in the sector.
Regulatory option 2: Performance standard regulations for coal-fired electricity generating units under CEPA 1999
The Regulations for the coal-fired electricity sector will set a stringent performance standard for new coal-fired units and those that have reached the end of their useful life. The performance standard will ensure a corresponding transition towards lower- or non-emitting types of generation, such as high-efficiency natural gas, renewable energy, or fossil fuel-fired power with carbon capture and storage.
The performance standard approach is administratively simpler and more efficient to implement compared to a cap-and-trade system, as it does not require the creation of a complex trading system to address emissions from a relatively narrow sector of the overall economy. The use of a performance standard that does not specify the fuel or technology to be used increases the potential for innovative response.
In doing so, the Regulations provide regulatory certainty for the coal-fired electricity sector at a time when the sector is facing major capital stock turnover. This regulatory certainty allows utilities to factor GHG emissions considerations into their plans for replacement of end of useful life units, to align those investments with capital stock turnover cycles to better control costs, and to avoid the risk of stranded assets.
Given the above considerations, a regulated performance standard was determined to be the preferred approach to address GHG emissions from the coal-fired electricity generation sector. Through consultations, industry and provincial stakeholders have expressed general support of the regulated performance standard approach with consideration of specific issues.
Taking action now to regulate coal-fired electricity generation will achieve multiple economic and environmental objectives for decades by providing investors, utilities, and electricity consumers with a regulatory environment that leads to both efficient and more certain reductions in CO2 emissions from this sector as well as reductions in a wide range of air pollutants that negatively affect human health and the environment. This regulatory approach will avoid the lock-in of long-lived dirty electricity infrastructure that would increase the costs of reducing greenhouse gas emissions in Canada in the future.
7. Benefits and costs
Several notable changes have been incorporated into the cost-benefit analysis since the CGI publication to reflect comments received and to incorporate new data. Along with the incorporation of the policy changes to the Regulations proposed in CGI, consultations with provincial, territorial, and industry officials have resulted in significant adjustments to the parameters underlying the projections for both the business-as-usual (BAU) and regulatory scenarios, and new data such as updated capital costs and fuel prices have been incorporated into the CBA.
Saskatchewan officials indicated that the provincial utility intends to implement CCS technology as a response to the regulatory performance standard. Where the captured CO2 is used for enhanced oil recovery, it generates additional benefits as a result of incremental oil production. The CGI analysis had assumed new natural gas capacity, increased utilization rates of existing units, and increased net imports were the most efficient way to meet the standard for all provinces.
Consultations with Nova Scotia government officials resulted in the inclusion of the provincially regulated 40% renewable mandate and increased impacts of demand-side management (DSM) programs. The CGI analysis had incorporated a 20% renewable mandate, as it was the only renewable program legislated at the time.
Alberta officials were able to provide additional insight and details into their unique market structure, allowing E3MC to better capture the way their competitive system would interact with the Regulations. This led to larger price impacts, which had an impact on the demand response and caused a larger incremental decrease in electricity demand relative to CGI.
The purpose of this CBA section is to describe the major policy and modelling changes and present the expected impacts stemming from the revised analysis. Impacts are highly concentrated in Alberta, Saskatchewan, and Nova Scotia. Hence, these provinces are the focus of the CBA section.
Summary
The Regulations will ensure a permanent transition to lower- or non-emitting types of electricity generation, which will have significant impacts on many stakeholders. It is estimated that, over a period of 21 years, 6 820 MW of coal-fired electricity capacity will be retired or avoided due to the Regulations, with the majority of retired and avoided capacity occurring in Alberta (74%), followed by Nova Scotia (14%), and Saskatchewan (11%). At the same time, it is estimated that 3 513 MW of incremental natural gas capacity will be added by 2035, with the largest additions in Alberta.
The owners and operators of electricity generating facilities can respond to the Regulations in several manners. In Environment Canada’s economic modelling of the Regulations, the majority of retired coal-fired generating capacity is replaced with natural-gas fired generation, while three coal-fired plants are expected to employ carbon capture and storage technology. The rest of the generation comes either from increased production from existing plants or through a combination of reduced exports and increased imports to and from the United States. Each of these alternatives imposes costs on the electricity sector, which in turn are expected to be largely passed on to consumers in the form of higher prices for electricity, which will result in reduced demand for electricity.
The incorporation of natural-gas fired generation and carbon capture and storage technology results in significant health and environmental benefits for Canadians in the form of reduced GHG emissions and criteria air contaminant (CAC) emissions. With the application of CCS, captured CO2 can be used for enhanced oil recovery (EOR), which increases the amount of oil that can be recovered from wells while at the same time permanently storing the CO2 underground. Overall, the estimated benefits of the Regulations greatly outweigh the estimated costs. A list of quantified and/or monetized impacts is presented in Table 4.
In summary, the NPV of the Regulations in 2015 over the study period is estimated at $7.3 billion. The present value of the benefits is estimated at $23.3 billion, largely due to the avoided costs of climate change ($5.6 billion), avoided generation costs ($7.2 billion), health benefits from reduced smog exposure ($4.2 billion), and additional oil extracted through enhanced oil recovery ($6.1 billion). The present value of the costs is estimated at $16.1 billion, largely due to incremental purchase of natural gas fuel ($8.0 billion), oil extraction costs for enhanced oil recovery ($1.3 billion), reduced exports ($0.3 billion) and new capital ($1.9 billion).
In contrast to the CGI analysis, the NPV of the Regulations has increased substantially from $1.5 billion to $7.3 billion. This increase is largely attributable to the timeframe of the analysis, which was extended outwards from 2015–2030 to 2015–2035 to adequately capture the longer-term impacts of the Regulations and the inclusion of costs and benefits associated with CCS technology and enhanced oil recovery.
Table 4: Monetized Benefits and Costs of the Regulations
| Benefits | Costs |
|---|---|
|
|
7.1 Analytical framework
The standard approach to cost-benefit analysis is to identify, quantify and monetize the incremental costs and benefits of the Regulations. In this analysis, incremental impacts have been estimated in monetary terms to the extent possible and are expressed in 2010 Canadian dollars except when otherwise noted. Where this was not possible, due either to lack of appropriate data or difficulties in valuing certain components, incremental impacts were evaluated in qualitative terms. Finally, it should be noted that the numbers and percentages as presented in tables may not be completely consistent due to rounding.
The cost-benefit analysis framework applied to this study incorporates the following elements:
7.1.1 Scope of the analysis
The cost-benefit analysis presented in CGI examined the impacts of displacing coal-fired generation with generation from new natural gas capacity and increased utilization of existing units and changes in trade flows. Therefore, the scope of the analysis was limited to the electricity and coal sectors. To examine the impact of the proposed Regulations on natural gas price, Environment Canada commissioned a report from Ziff Energy (section 7.7.2).
During an extensive consultation process after CGI publication, Saskatchewan officials indicated that under the Regulations, SaskPower would employ CCS technology to meet the performance standard. The benefits of employing CCS for Saskatchewan include life extension of existing coal-fired units, continued use of a low cost and naturally abundant fuel in an environmental sustainable manner, continued existence of the province’s traditional coal sector, and extraction of stranded oil. The costs of expanded CCS are expected to manifest themselves in the form of substantial costs for retro-fitting facilities to be CCS compliant and higher electricity prices for electricity consumers in Saskatchewan relative to the BAU scenario.
The decision to respond to the Regulations through the expansion of coal CCS has resulted in additional cost and price impacts above and beyond what were considered in the CGI analysis. Major benefits of electricity generation through coal CCS units are reduced CO2 emissions and increased productivity of oil extraction. To capture the effects of EOR, the analysis has been expanded to include the oil extraction sector.
7.1.2 Timeframe for analysis
Due to the new definition of end-of-life, (see footnote 23) as described under section 5.1, the regulated retirement dates for several coal-fired units have been postponed. To align with the new end-of-life definition and present an analysis that adequately captures the longer-term costs and benefits, the study period was extended from 16 years (2015–2030) to 21 years (2015–2035). This decision also addresses a comment which stated the CGI analytical timeframe was too short. The first year of the analysis is 2015, when the Regulations come into effect.
7.1.3 Discount rate
A social discount rate of 3% is used in the analysis for estimating the present value of the costs and benefits in 2015 under the central analysis. This is consistent with the Treasury Board Secretariat’s cost-benefit analysis guidelines and is what was used in CGI. This is consistent with the discount rates that have been used for GHG-related measures in Canada, as well as that being used by the U.S. EPA. Costs and benefits were discounted to base year 2015, the first year the Regulations come into effect. A sensitivity analysis of the discount rate was conducted to test the robustness of the results.
7.1.4 Incremental impact
Impacts are analyzed in terms of incremental changes to emissions, costs and benefits to stakeholders and Canadian society. The incremental impacts were determined by comparing two scenarios: the business-as-usual (BAU) scenario and the regulatory scenario. The two scenarios are presented in detail below.
It is important to note that the analysis presented below for the BAU and regulatory scenarios are performed using the E3MC modelling results. While based on the best information currently available, these results present one possible scenario which, like all long-term projections, is subject to significant uncertainty regarding specific projections, e.g. regarding specific new plants, retirements, or other data and assumptions.
7.1.5 BAU scenario
The BAU establishes what the electricity sector is expected to look like in the future without the Regulations. This scenario was established for the CGI analysis (CGI BAU) by incorporating pre-existing federal (see footnote 24) or provincial policies (see footnote 25) including the Ontario coal phase-out as described in section 5.2.5; economic and demographic factors that affect the electricity market such as population and housing development; and private decisions to build a new unit or retire an old unit, etc.
Since the publication of the CGI analysis, several changes have been made to the BAU scenario to reflect comments received and to incorporate new data. Notable changes from CGI include new information on plant closure and replacement decisions:
- Two units at Sundance were closed in 2011 and hence are no longer relevant for the analysis. These units were previously included in the CGI BAU and were affected by the proposed Regulations.
- H. R. Milner was assumed to be retired in 2014 in the BAU and hence not affected by the proposed Regulations. In this revised analysis, this plant is included in the BAU and affected by the Regulations.
- Coleson Cove was assumed to continue to operate indefinitely in the CGI BAU. In the CGII BAU, it retires in 2031, while under the Regulations it retires one year earlier.
- Nova Scotia’s renewable energy target of 40% in 2020 and demand side management plans are now completely incorporated. Full details on these measures were not available at the time of CGI. The analysis also now includes exports from the Muskrat Falls facility, which is part of the Lower Churchill project, to Nova Scotia via a link between Newfoundland and Labrador.
- Projected population growth in Nova Scotia and Alberta’s industrial electricity demand were revised as a result of consultations with provincial officials.
- Keephills 3 was modeled to employ CCS technology (Project Pioneer) in the CGI BAU. The analysis for CGII excludes Project Pioneer due to the recent announcement that the project will not proceed.
Presented below are the unit retirements and new coal and gas units under the BAU for the revised analysis.
Coal-fired electricity generation unit retirements and new and rebuilt units
Table 5 shows the coal unit retirements (closures) under the BAU. All retirements except one in New Brunswick occur by the year 2015. Overall, 7 520 MW of capacity and 22 units are retired, largely driven by the Ontario coal phase-out which accounts for 6 077 MW and 15 units of 22 units retiring under the BAU. (see footnote 26) In total, 45% of the total coal capacity as of 2010 is assumed to be retired by 2031.
Table 5: Coal-fired Unit Retirements in the BAU Scenario
| Region | Units | Retirement Years (see footnote 27) | Coal Capacity Retired (MW) | Coal Capacity in 2010 (MW) | Retired 2010 Canadian Capacity |
|---|---|---|---|---|---|
| Alberta | 3 | 2011 | 900 | 6 305 | 5% |
| Ontario | 15 | 2011 | 6 077 | 6 077 | 37% |
| 2013 | |||||
| 2015 | |||||
| Saskatchewan | 2 | 2014 | 132 | 1 822 | 1% |
| Nova Scotia | 1 288 | 0% | |||
| New Brunswick | 2 | 2011 2031 | 411 | 891 | 2% |
| Manitoba | 97 | 0% | |||
| Total | 22 | - | 7 520 | 16 481 | 46% |
With almost 50% of the coal-fired capacity retiring, the construction of coal and natural gas plants is required in order to meet electricity demand. Overall, 2 534 MW of new coal capacity are projected to be constructed or rebuilt — three new industry-announced units (for a total of 1 219 MW) and three which are projected to be built by E3MC (for a total of 1 200 MW) in Alberta, (see footnote 28) and a rebuilt unit in Saskatchewan (115 MW). (see footnote 29) Two of the new units (i.e. Swan Hills and Boundary Dam 3) are modelled to employ CCS technology to align with recent announcements. Furthermore, 13 541 MW (see footnote 30) of additional net gas capacity is projected to be built by 2035. The additions are primarily in Ontario (6 502 MW), Alberta (6 543 MW), and Saskatchewan (1 727 MW), while Nova Scotia and Manitoba add 52 MW and 550 MW of capacity respectively. (see footnote 31)
For other units, it is assumed they do not automatically retire at the end of their useful life, but instead are refurbished at an estimated cost of around $395/kW (see footnote 32) (undiscounted) and continue generating electricity as the lowest cost option for another 25 years.
7.1.6 Regulatory scenario
The regulatory scenario establishes what the electricity sector is expected to look like with the implementation of the Regulations. For the CGI analysis, E3MC was used to assess the impacts of the proposed Regulations, which required owners and operators to meet a performance standard of 375 tonnes of CO2/GWh. Following an extensive consultation and to address stakeholders’ concerns, the emission performance standard increased from 375 tonnes to 420 tonnes of CO2/GWh. The definition of end-of-life was also revised to mitigate impacts as described in section 5.1.
It is expected that utilities, whether privately owned or Crown owned, will choose to implement the compliance option that maximizes their net benefits and meets their objective, should it be social or private, in meeting the performance standard. The responses to the performance standard include new natural gas capacity, increased utilization of existing units, and the deployment of CCS. As shown in the CGI analysis, new natural gas capacity and increased utilization rates of the existing units were the most efficient ways to meet the standard for all provinces.
However, after the publication of the CGI analysis, Saskatchewan officials indicated that over the long term, CCS is the most effective means of compliance in consideration of the potential impacts of the Regulations on its traditional coal mining sector as well as the potential to realize benefits from EOR by using captured CO2. As a result, the revised analysis assumes Boundary Dam units 4, 5, and 6 continue to operate with carbon capture and storage under the regulatory scenario. In the CGI analysis, Boundary Dam units 4, 5, and 6 were assumed to be retired due to the proposed Regulations.
The deployment of CCS entails significant capital costs. For example, as presented in “EOR, An Opportunity for Alberta, Alberta Economic Development Agency, January 2009,” the cost of capturing and sequestering is estimated to be about $80/tonne in the early years. Part of this cost can be recovered from selling CO2 for use in EOR. However, when considering the economics of EOR, the cost of the CO2 must be in the range of about $20/tonne–$40/tonne to make an EOR project viable. This still yields a range of a net cost of $40–$60/tonne. (see footnote 33) In facing the Regulations, from a societal perspective, the use of CCS to capture CO2 emissions would result in the continued use of locally abundant coal resources, allow for the retention of employment in coal-fired generation plants and coal mining, incremental oil production, and generate employment and other economic opportunities (e.g. Canadian suppliers to these projects could be well positioned to export their technologies to the rest of the world). The collection of CO2 revenues, royalties, and corporate income taxes, all due to increased economic activity from the deployment of CCS, and higher electricity prices, help to close the gap in the net cost per tonne of CCS deployment from the provincial perspective.
The scope of the analysis has been extended to include the costs and benefits of the incremental oil extraction. In estimating the costs and benefits, the following assumptions are made:
- Costs of EOR are $6/barrel (bbl) of oil produced for capital, $9/bbl for O&M, $9.60/bbl for CO2 recycle costs. (see footnote 34)
United States Department of Energy, Improving Domestic Energy Security and Lowering CO2 Emissions with “Next Generation” CO2-Enhanced Oil Recovery (CO2-EOR), June 20, 2011, Table V-1. These figures were also considered rel-evant within the Canadian context by EC experts. - GHG emissions are assumed to increase as per the average emissions per bbl of Canadian conventional oil production.
- For the central case, oil has been valued at the forecasted price of West Texas Intermediate (WTI) from E3MC, which is based on National Energy Board (NEB) projections.
- The use of one tonne of CO2 for EOR results in three incremental bbl of oil production. (see footnote 35)
Coal-fired unit retirements and compliance flexibility options
Under the regulatory scenario modelled, coal units retire (close) at the end of their useful life or continue operating if they employ CCS. Although compliance flexibility options are available to all units that meet the criteria, for the purposes of modelling and based on expected responses to the Regulations, they were accounted for in the analysis as follows:
- Substitution: This flexibility was modelled to affect Nova Scotia. Trenton 5 swaps with Lingan 1, and Point Tupper 1 swaps with Lingan 2.
- CCS Deferral: The flexibility was modelled to affect Boundary Dam units 4 and 5 in Saskatchewan so that these units will not be required to meet the performance standard until 2025.
- Fuel switching: Point Tupper 1 (subsequently transferred to Lingan 2) and Coleson Cove 3 all have 18 months added to their end of life for re-commissioning to burn coal from oil.
Table 6 shows the coal units that are expected to retire by 2035 as a result of the Regulations. Overall, 5 452 MW of capacity and 20 units are retired, predominantly in Alberta (3 366 MW), which represents 62% of retired capacity.
Decommission costs of (undiscounted) $96/KW (see footnote 36) are assumed for coal units closed due to the Regulations. A sensitivity analysis is provided in section 7.6 to account for the large variation in decommissioning costs.
Table 6: Coal-fired Unit Retirements Due to the Regulations — By 2035
Region |
Units |
Coal Generation Capacity Retired |
Retirement Year |
|---|---|---|---|
Alberta |
10 |
3 366 |
2020 |
2020 |
|||
2026 |
|||
2027 |
|||
2028 |
|||
2029 |
|||
2030 |
|||
2030 |
|||
2030 |
|||
2030 |
|||
Saskatchewan |
2 |
686 |
2030 |
2030 |
|||
Nova Scotia |
6 |
952 |
2020 |
2022 |
|||
2030 |
|||
2030 |
|||
2030 |
|||
2030 |
|||
New Brunswick |
1 |
350 |
2030 |
Manitoba |
1 |
97 |
2030 |
Total |
20 |
5 452 |
- |
7.2 Economic tools, data and information sources
This analysis uses various sources, including a significant amount of data provided by provincial officials during the extensive post-CGI consultations.
7.2.1 Capacity, generation, emissions
This analysis is based on the modelling results done by Environment Canada (EC) using its E3MC model. Specifically, data on capacity, demand, generation, GHGs (CO2e), CACs, and mercury emissions for both BAU and regulatory scenarios were populated from E3MC.
The Energy, Emissions and Economy Model for Canada has a dynamic view of the electricity system. When one unit closes, generation will be replaced with the least expensive option. Therefore, coal-fired unit closures will not always be replaced with a new plant if there are other less expensive options available. For example, in some cases, the most economically attractive option may be to compensate for lost generation from retiring coal-fired generation with additional generation from existing units with surplus capacity.
It is important to note that E3MC’s results provide only a central point estimate, projecting one plausible scenario of the many future pathways of generation and emissions. The projection reflects a wide range of assumptions that are based on expert-driven knowledge and both public and private data as of April 2012. As with any projection, these assumptions will ultimately differ from reality. For example, some coal-fired units assumed to close in the BAU scenario may not close in reality (and vice versa). Changes to key assumptions (e.g. macroeconomic outlook, utility plans, or development in commercially available technologies) would lead to different outcomes.
7.2.2 Fuel prices
The natural gas price projection used in the CGI analysis was based on the most up-to-date forecast available at the time, which came from Natural Resources Canada. Subsequently, the natural gas price projection has been updated to reflect a more recent forecast. These prices are somewhat higher than the CGI prices. Section 7.6.2 contains the results of a sensitivity analysis on the impact of future natural gas prices on consumer prices.
Projections of natural gas and coal prices to utility by province used in this analysis are based on estimates generated by E3MC, which are based on historical natural gas and coal costs for utilities by province from Statistics Canada. These historical prices are then grown by the projected growth rate of natural gas and coal prices from the National Energy Board (NEB). (see footnote 37) These prices are shown for key provinces in Figures 3a and 3b. In general, the price of natural gas in one region differs from the price in another region only by the cost of transportation to get the gas to the end user.
While coal is produced in Alberta and Saskatchewan, Manitoba and Nova Scotia are dependent on imports. Manitoba generally imports coal from North Dakota for coal-fired generation, while Nova Scotia purchases bituminous coal on the international market that is generally of higher quality than the sub-bituminous and lignite coal used in Western Canada.
The NEB forecast underlying the natural gas prices used in the analysis projects an increase from US$4.50/MMBtu in 2011 to US$8.00 in 2035 at Henry Hub (in U.S. 2010 dollars). This could be considered conservative, as the most recent U.S. Energy Information Administration forecast (Annual Energy Outlook 2012 [AEO2012]) projects much slower price increases, reflecting the continued industry success in tapping extensive shale gas resources in the United States, which has led to a 19% increase in U.S. natural gas production since 2006. Particularly, forecast prices for natural gas remain below US$5 through 2023, and then start to increase as production gradually shifts to resources that are less productive and more expensive, with the price rising to US$6.53 by 2035.
The coal price forecast underlying the prices used in the analysis remains relatively flat at 2011 prices throughout the forecast period for all provinces. The majority of coal imported to Nova Scotia for electricity generation comes from the United States, and the average price of coal increases by 1.4% per year in the AEO2012 reference case.
The modelling results find no change in these projected prices due to the Regulations. For natural gas, independent research (see footnote 38) commissioned by Environment Canada concluded that an increase in demand of less than 1% in the overall North American market, as is the case for the Regulations, would not have a significant effect on natural gas prices.
The analysis also employs WTI oil price forecasts in its monetization of EOR. This price forecast is taken from E3MC, which is also based on the NEB forecast.
Figure 3a: Forecasted Natural Gas Prices — E3MC (2015–2035)
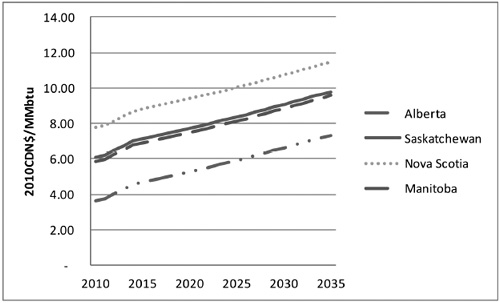
Figure 3b: Forecasted Coal Prices — E3MC (2015–2035)
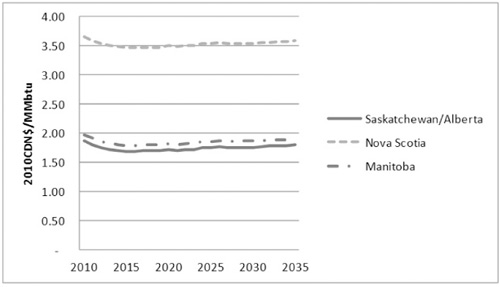
7.2.3 Import and export prices of electricity
The price forecasts for imports and exports of electricity are calculated within E3MC based on the historical mix and outlook of future mix of short- and long-term electricity export contracts. The prices of short-term and long-term electricity contracts vary systematically; thus assumptions on the future contract mix will influence forecasted prices. Imports from the United States are based on the weighted average cost of power from the importing area.
7.2.4 Air quality modelling
To estimate how these emission reductions will impact human health and the environment, Environment Canada first used A Unified Regional Air-Quality Modelling System (AURAMS) to predict how the emission changes will affect local air quality. (see footnote 39) This is a fully three-dimensional state-of-the-art numerical model described in peer-reviewed scientific literature. (see footnote 40) AURAMS combined the information on predicted emission changes, with information on wind speed, temperatures, humidity levels, and existing pollution levels, in order to predict how these emissions changes will impact local air quality. (see footnote 41)
The CAC emissions (and resulting changes) are determined using emissions coefficients based on the 2009 National Pollutant Release Inventory (NPRI). The coefficients are determined by dividing a specific emission for 2009 by an economic driver for 2009 (e.g. volume of fuel used or volume of output). The results are then inputted into AURAMS.
7.2.5 Health and environmental benefits resulting from CAC reductions
The reductions in CAC emissions improve air quality, resulting in health and environmental benefits. Environmental benefits are estimated using Environment Canada’s Air Quality Valuation Model (AQVM2). Health risks and impacts are estimated by Health Canada using the Air Quality Benefits Assessment Tool (AQBAT). (see footnote 42)
7.3 Costs
7.3.1 Demand
As stated above, the demand for electricity used in this analysis is obtained from Environment Canada’s E3MC model. Under the BAU, the total demand for electricity is projected to increase from 538 TWh in 2015 to 652 TWh by 2035 (Table 7).
Under the regulatory scenario, relative to the BAU, the demand for electricity declines slightly by 2035, from 652 TWh to 646 TWh. This 6 TWh (0.79%) reduction is primarily attributable to the response of the industrial sector to the price impacts of the Regulations.
Table 7: Electricity Demand (TWh) by Sector — Canada
Sector |
2015 |
2030 |
2035 |
||||||
|---|---|---|---|---|---|---|---|---|---|
BAU |
Reg |
% Diff |
BAU |
Reg |
% Diff |
BAU |
Reg |
% Diff |
|
Residential |
166 |
166 |
0.00% |
176 |
176 |
-0.19% |
180 |
179 |
-0.24% |
Commercial |
156 |
156 |
0.00% |
185 |
185 |
-0.27% |
197 |
196 |
-0.31% |
Industrial |
216 |
216 |
0.00% |
257 |
253 |
-1.39% |
274 |
270 |
-1.50% |
Transportation |
1 |
1 |
0.00% |
1 |
1 |
0.00% |
1 |
1 |
0.00% |
Total |
538 |
538 |
0.00% |
620 |
615 |
-0.71% |
652 |
646 |
-0.79% |
7.3.2 Capacity
Under the regulatory scenario, incremental to the BAU, coal-fired electricity generating capacity is expected to be reduced by 6 820 MW by 2035 (Table 8). This is mainly due to the 20 coal units retired (Table 6) but it is also due to avoided coal builds. Overall, 3 513 MW of incremental natural gas capacity is added by 2035 with the largest additions in Alberta, followed by Nova Scotia (Table 8). Minor additions in renewable capacity are also projected to occur. The net reduction in capacity (-3 290 MW) is the product of provinces leveraging existing capacity that is under-utilized to comply with the Regulations. More specifically, under the BAU,
- the average capacity utilization at coal-fired units in Canada is 91% by 2035 (increasing to 95% under the regulatory scenario); and
- the average capacity utilization at natural gas-fired units in Canada is 43% by 2035 (increasing to 54% under the regulatory scenario).
Table 8: Incremental Change in Generation Capacity (MW) by 2035
Region |
Coal |
Natural Gas |
Others (see footnote 43) |
Total |
|---|---|---|---|---|
AB |
-5 016 |
2 584 |
-24 |
-2 456 |
SK |
-754 |
100 |
-9 |
-663 |
NS |
-952 |
555 |
-2 |
-398 |
MB |
-97 |
99 |
2 |
3 |
Canada (see footnote 44) |
-6 820 |
3 513 |
17 |
-3 290 |
Note that Sundance 7, 8, and 9 are expected to come on line as natural gas plants as advised by Alberta. Therefore, these units are added to the regulatory scenario. In costing the new capacity (capital, average fixed O&M, and average variable O&M costs), Environment Canada uses publicly available information such as the U.S. Energy Information Administration’s AEO 2011 and input from stakeholders for some specific units.
7.3.3 Generation
As coal plants shut down, both in the BAU and in the regulatory scenario, and natural gas units are built, a change in generation mix occurs. Under the BAU, coal-fired electricity generation remains at 69 TWh in 2015 increasing to 79 TWh by 2035 (Table 9). Over the same period, natural gas generation increases from 56 TWh in 2015 to 87 TWh in 2035.
Under the regulatory scenario, coal-fired generation decreases to 65 TWh by 2025, reaching 35 TWh by 2035 (55% decrease from the BAU). Of these 35 TWh generated by coal-fired generation, 8 TWh are estimated to be generated by coal CCS. In 2035, around 68% of Saskatchewan’s total coal generation is projected to be from coal CCS. Moreover, natural gas generation increases to 79 TWh by 2025, reaching 126 TWh by 2035 (44% increase from BAU). There is a negligible impact on non-emitting generation.
Table 9: Electricity Generation (TWh) by Fuel Type — Canada
Type |
2015 |
2025 |
2030 |
2035 |
||||||||
|---|---|---|---|---|---|---|---|---|---|---|---|---|
BAU |
Reg |
% Diff |
BAU |
Reg |
% Diff |
BAU |
Reg |
% Diff |
BAU |
Reg |
% Diff |
|
Coal |
69 |
69 |
0% |
70 |
65 |
-8% |
70 |
37 |
-48% |
79 |
35 |
-55% |
Natural gas |
56 |
56 |
0% |
75 |
79 |
6% |
84 |
113 |
34% |
87 |
126 |
44% |
Oil |
6 |
6 |
0% |
4 |
5 |
7% |
5 |
4 |
5% |
4 |
4 |
-1% |
Non-emitting |
536 |
536 |
0% |
585 |
585 |
0% |
604 |
604 |
0% |
619 |
620 |
0% |
Total |
667 |
667 |
0% |
735 |
734 |
0% |
763 |
759 |
-1% |
790 |
786 |
-1% |
Over 2015 to 2035, relative to BAU, there is a total reduction in coal-fired generation of 298 TWh (Table 10) from provinces primarily affected by the Regulations (Alberta — -252; Saskatchewan — -27; Nova Scotia — -20). This displacement of generation from coal-fired units is mostly offset by a 256 TWh increase in natural gas generation (Alberta — 222; Saskatchewan — 22; Nova Scotia — 8). This yields a reduction in generation of 39 TWh, which is mainly due to reduced demand.
Table 10: Change in Electricity Generation and Flows by Region, 2015–2035 (TWh)
Region |
Generation |
Net Imports |
|||||
|---|---|---|---|---|---|---|---|
Coal |
Natural Gas |
Petrol |
Non-Emitting (see footnote 46) |
Total |
From Provinces |
From U.S. |
|
SK |
-27 |
22 |
0 |
0.1 |
-5 |
8 |
4 |
NB |
1 |
1 |
-1 |
1.0 |
2 |
-6 |
0 |
AB |
-252 |
222 |
0 |
-0.6 |
-30 |
0 |
0 |
NS |
-20 |
8 |
3 |
0.0 |
-9 |
7 |
0 |
Canada (see footnote 48) |
-298 |
256 |
2 |
1.3 |
-39 |
0 |
4 |
7.3.4 Imports and exports of electricity
Under the BAU, electricity imports would increase from 14 TWh in 2015 to 19 TWh by 2035 (Table 11). Over the same period, electricity exports would increase from 68 TWh in 2015 to 86 TWh in 2025, and then decline to 85 TWh by 2030 and to 77 TWh in 2035. The sharp decline in electricity exports post 2030 is projected to occur because, over time, under the BAU, the excess capacity previously being exported is being relied upon to meet the domestic market (e.g. new capacity is not built to support the export market).
Under the regulatory scenario, electricity imports would increase to 19 TWh by 2035 (2% increase from BAU). Moreover, electricity exports would increase to 86 TWh by 2025, and then decline to 83 TWh by 2030, and to 76 TWh by 2035 (2% decrease from BAU). The Regulations would cause Canada to rely marginally more on imports, while reducing its electricity exports since a greater portion of its capacity would now be required to accommodate the demand from the domestic market. As imports increase and exports decrease, net electricity imports increase, although it should be noted that Canada remains a net exporter of electricity and imports will still represent a small share of overall electricity demand in Canada under the Regulations.
Table 11: Electricity Exports and Imports — Canada (TWh)
Type |
2015 |
2025 |
2030 |
2035 |
||||||||
|---|---|---|---|---|---|---|---|---|---|---|---|---|
BAU |
Reg |
% Diff |
BAU |
Reg |
% Diff |
BAU |
Reg |
% Diff |
BAU |
Reg |
% Diff |
|
Imports |
14 |
14 |
0% |
18 |
18 |
1% |
19 |
19 |
3% |
19 |
19 |
2% |
Exports |
68 |
68 |
0% |
86 |
86 |
-1% |
85 |
83 |
-2% |
77 |
76 |
-2% |
Net imports |
-55 |
-55 |
0% |
-69 |
-68 |
-1% |
-66 |
-64 |
-4% |
-58 |
-57 |
-3% |
7.3.5 Interprovincial trade flows
As a result of the Regulations, there will likely be some key shifts in interprovincial electricity trade flows. These would be required to support the displaced coal-fired generation from affected provinces. More specifically, relative to BAU, over 2015 to 2035,
- Nova Scotia exports less to New Brunswick (5 TWh) and imports more from New Brunswick (2 TWh);
- Manitoba exports more to Saskatchewan (8 TWh) and imports more from Ontario (1 TWh); and
- Quebec exports more to New Brunswick (1 TWh) and imports less from New Brunswick (1 TWh).
Environment Canada’s modelling assumed that no new infrastructure would be built to allow a significant increase in electricity trade. While Environment Canada’s model has the capacity to build interprovincial and international flows, due diligence was undertaken to ensure that provincial plans are fully respected (i.e. the model only builds new transmission that is provided in provincial plans). If new infrastructure is built, then the model includes the full cost related to the building of the new transmission capacity.
7.3.6 Costs and avoided costs to the electricity sector
Table 12 shows the present value of various major costs and avoided costs under the Regulations. Over the 2015 to 2035 time period, the Regulations would force traditional coal plants to retire, promoting the expansion of plants with lower levels of greenhouse gas emissions.
When a coal plant closes, there is a cost of decommissioning the plant, and a savings associated with the avoided fixed and variable O&M costs, as well as the avoided coal costs and avoided future refurbishments. However, since the period of study ends at 2035, the residual value of the avoided refurbishments is netted off by amortizing the initial costs over the expected lifetime of the investment to ensure that only benefits accrued within the study period are included in the calculations.
When a natural gas or coal CCS plant opens there are costs associated with it, including new capital investments, fuel costs, as well as additional fixed and variable O&M costs. Once again, the residual value of the new capital investments is netted off to ensure that only costs within the period of study are analyzed. This is done using the same methodology as with the residual value of the avoided refurbishments.
Finally, the Regulations prevent some planned coal units from being built. These avoided builds come with benefits of avoided capital investments (and their residuals, treated in the same manner as described above), as well as avoided coal fuel costs and avoided fixed/variable O&M costs.
The present value of capital costs (including avoided refurbishments, additional capital and avoided capital investments, and their corresponding residuals) increases by $67 million over the study’s time period. The present value of the net fuel costs (netting the coal savings from the natural gas costs) increases by $4,461 million. The present value of the net fixed O&M costs decreases by $582 million, while the present value of the net variable O&M costs increases by $2,778 million. The cost of decommissioning the retired coal plants comes to a present value of $329 million. Overall, generation costs for the electricity utility generation sector increase by $7,052 million over the study period due to the Regulations.
Table 12: Change in Generation Costs — Canada
(Present Value in Millions of 2010 Dollars)
Cost category |
2015 |
2020 |
2025 |
2030 |
2035 |
Cumulative — 2015 to 2035 |
|---|---|---|---|---|---|---|
Net capital costs |
0 |
-92 |
1,148 |
1,239 |
-530 |
67 |
Net capital investment |
0 |
68 |
1,236 |
2,107 |
-1,372 |
751 |
New capital investments |
0 |
68 |
1,406 |
2,145 |
356 |
6,365 |
Residual value of capital |
-4,419 |
-4,419 |
||||
Avoided capital investments |
0 |
0 |
-170 |
-39 |
-2,210 |
-6,095 |
Residual value of avoided capital |
4,900 |
4,900 |
||||
Net refurbishments |
0 |
-160 |
-88 |
-867 |
842 |
-684 |
Avoided refurbishment of coal units |
0 |
-160 |
-88 |
-867 |
0 |
-1,526 |
Residual value of avoided refurbishments |
842 |
842 |
||||
Net fuel costs |
0 |
77 |
68 |
461 |
720 |
4,461 |
Increased natural gas |
0 |
155 |
153 |
881 |
1,091 |
7,954 |
Avoided coal |
0 |
-78 |
-85 |
-420 |
-371 |
-3,494 |
Net fixed O&M |
0 |
-2 |
-16 |
-77 |
-72 |
-582 |
Additional fixed O&M |
0 |
2 |
7 |
28 |
38 |
250 |
Avoided fixed O&M |
0 |
-4 |
-22 |
-105 |
-110 |
-833 |
Net variable O&M |
0 |
107 |
69 |
232 |
334 |
2,778 |
Additional variable O&M |
0 |
129 |
99 |
344 |
465 |
3,810 |
Avoided variable O&M |
0 |
-22 |
-30 |
-112 |
-131 |
-1,032 |
Decommissioning costs |
0 |
39 |
0 |
210 |
0 |
329 |
Total: Generation costs |
0 |
128 |
1,269 |
2,065 |
451 |
7,052 |
Table 13 shows the present value of the change in generation costs for key provinces. Over 2015 to 2035, the largest increase would be for Alberta ($5,882 million), followed by Saskatchewan ($1,174 million), Manitoba ($95 million) and Nova Scotia (-$217 million).
Table 13: Change in Generation Costs, by Region
(Present Value in Millions of 2010 Dollars)
Region |
Net Capital Costs |
Net Fuel Costs |
Net O&M |
Decomm. Costs |
Total |
|---|---|---|---|---|---|
AB |
-421 |
3,722 |
2,362 |
219 |
5,882 |
MB |
13 |
76 |
1 |
6 |
95 |
NS |
-43 |
-148 |
-90 |
65 |
-217 |
SK |
479 |
745 |
-88 |
39 |
1,174 |
Total for Above Regions |
27 |
4,394 |
2,185 |
328 |
6,934 |
Alberta
The majority of the incremental generation costs in Alberta due to the Regulation are fuel and O&M costs. Net capital costs are negative because the avoided costs for refurbishment and capital are greater than the capital investment in natural gas. The incremental fuel costs are much greater because of the spread between coal and natural gas prices to electric utilities.
Nova Scotia
The Regulations create incremental avoided generation costs for Nova Scotia. Although the cost of additional plant builds is greater than the avoided builds, the additional avoided refurbishment costs associated with the decommissioned plants causes a net avoided capital cost.
In addition, despite the increase in unit fuel costs due to the spread between natural gas and coal prices to electrical utilities, Nova Scotia experiences a decrease in total fuel costs. This is because coal generation decreases by over two times the amount that natural gas generation increases, partially as a result of Nova Scotia’s DSM policies, but also due to decreased interprovincial exports and increased interprovincial imports. (see footnote 49)
Saskatchewan
A large portion of the incremental generation costs are due to the capital costs of CCS. There are also increases in fuel costs as more generation moves from coal to natural gas.
7.3.7 Foreign imports/export costs
Over 2015 to 2035, cumulative U.S. electricity imports would increase by an incremental 4 TWh while cumulative exports decline by 13 TWh (Table 14). The reduction in coal generation would cause provinces to reduce their supply to the United States since this capacity would now be required to serve the domestic market. The increase in imports occurs in Saskatchewan and British Columbia, while reduced exports occur predominantly in New Brunswick, Manitoba, and Saskatchewan with smaller reductions in British Columbia and Ontario.
The value of foreign cumulative imports of electricity was determined by multiplying the change in imports by price. The price forecasts for imports and exports are calculated within E3MC as described above in section 7.2.3. Actual flows of electricity are determined annually and constrained by transmission capacity.
Over 2015 to 2035, the total present value of increased cumulative electricity imports is $72 million, with the largest increases in Saskatchewan ($65 million) and British Columbia ($11 million). The value of reduced cumulative foreign exports represents the foregone revenues. Over 2015 to 2035, the present value of reduced electricity cumulative exports would be $274 million, with the largest losses in New Brunswick ($152 million) and Saskatchewan ($69 million).
Table 14: Change in Foreign Cumulative Electricity Imports/Exports by Region
(Present Value in Millions of 2010 Dollars)
Region |
Change in U.S. Imports (TWh) |
PV of Increased Foreign Imports ($M 2010) |
Change in U.S. Exports (TWh) |
PV of Reduced Foreign Exports ($M 2010) |
|---|---|---|---|---|
ON |
0 |
1 |
0 |
-12 |
SK |
4 |
65 |
-3 |
-69 |
BC |
1 |
11 |
-1 |
-12 |
MB |
0 |
4 |
-4 |
-25 |
NB |
0 |
-7 |
-4 |
-152 |
Canada |
4 |
72 |
-13 |
-274 |
7.3.8 Oil extraction costs
One of the benefits of the Regulations is increased oil production through EOR with captured CO2 from CCS plants. The costs associated with this benefit are capital, fixed and variable O&M costs for oil extraction, and GHG emissions associated with this oil extraction. It should be noted that royalties, taxes and the cost of CO2 purchases represent transfers from one Canadian stakeholder to another, and are therefore excluded from the cost of production in the cost-benefit analysis, as per standard practice. Over the span of the Regulations the present value of the oil production costs is estimated to be $1,288 million, and the present value of GHG emissions is estimated to be about $140 million (for more details on how the value for GHG emissions is calculated, please refer to section 7.4).
7.3.9 Government costs
The federal government would incur incremental costs related to training, inspections, investigations, and measures to deal with any alleged violations, and compliance and promotion activities.
With respect to enforcement costs, one-time amounts of $142,000 for the training of enforcement officers and $50,000 to meet information management requirements will be required.
The annual enforcement costs are estimated to be about $105,000 broken down as follows: roughly $66,000 for inspections (which includes operations and maintenance costs and transportation and sampling costs), $16,000 for investigations, $2,000 for measures to deal with alleged violations (including warnings, environmental protection compliance orders and injunctions) and about $21,000 for prosecutions.
With respect to compliance promotion, in the first five years after the coming into force of the Regulations, activities are expected to be limited to inform the electricity sector of the reporting requirements. Compliance promotion activities, during this period, will be covered by routine administrative costs that are not considered incremental. Activities are expected to increase as units reach their end-of-life. This will result in additional costs for compliance promotion of $45,000 nominal in 2019 followed by an expense of $10,000 per year for the subsequent two years. Compliance promotion activities could include training of compliance promotion officers, information management, mailing out of the final Regulations, developing and distributing promotional materials (e.g. a fact sheet, Web material), responding to inquiries, attending trade association conferences, sending reminder letters, etc.
In addition to enforcement and compliance activities, the costs are estimated to be about $795,000 during the first year of the implementation of the Regulations. This includes the development of an electronic data entry system to support the reporting requirements. In subsequent years, the costs are estimated to be about $575,000 per year to administer the Regulations.
Over 2015 to 2035, the present value of government costs would be about $11 million.
7.4 Benefits
7.4.1 Benefits from GHG reductions
Since the GHG emissions generated from natural gas and coal CCS are significantly lower than coal, this would result in fewer GHG emissions. The coal emission factors differ by province due to the fact that different types of coal are available in different parts of the country. These emission factors are assumed to remain constant over the projection period. Natural gas emission factors do not vary across provinces or over the projection period.
Over 2015 to 2035, there would be cumulative reductions in GHGs from the utility sector as a whole, relative to BAU, of approximately 219 Mt (Table 15). (see footnote 50) The largest reductions would be in Alberta (160 Mt), followed by Saskatchewan (45 Mt) and Nova Scotia (15 Mt). These reductions are above and beyond existing and assumed federal and provincial actions. Figure 4 shows the GHG emissions in the electricity sector under the BAU and regulatory scenarios.
Table 15: GHG Emission Reductions from Utility Generation
Region |
Cumulative 2015–2035 |
Present Value of GHG |
|---|---|---|
AB |
160 |
4,131 |
SK |
45 |
1,144 |
NS |
15 |
385 |
Canada |
219 |
5,634 |
Figure 4: GHG Emission Profile
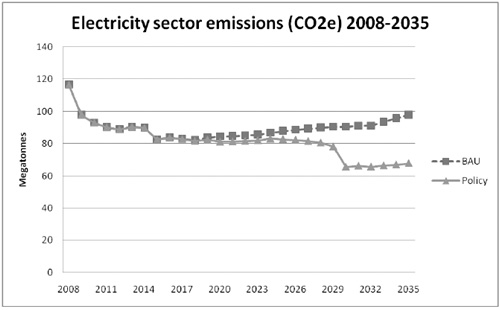
The estimated value of avoided damages from GHG reductions is based on climate change damages avoided at the global level, given that climate change is a global issue and it is not possible to directly associate climate change damages in any given region with greenhouse gas emissions from that region. The value placed on anticipated climate change damages is usually referred to as the social cost of carbon (SCC). Estimates of the SCC vary widely due to challenges in predicting future emissions, climate change, damages and determining the appropriate weight to place on future costs relative to near term costs (discount rate).
Social cost of carbon values used in this assessment draw on work undertaken by Environment Canada in collaboration with an interdepartmental federal government technical committee, and in consultation with a number of external academic experts. (see footnote 51) This work involved reviewing the existing literature and other countries’ approaches to valuing greenhouse gas emissions. Preliminary recommendations, based on current literature and in line with the approach adopted by the U.S. Interagency Working Group on the Social Cost of Carbon, (see footnote 52) are that it is reasonable to estimate SCC values at $26/tonne of CO2e in 2010, increasing at a given percentage each year associated with the expected growth in damages. (see footnote 53) Environment Canada’s review also concluded that a value of $104/tonne in 2010 should be considered for sensitivity analysis, reflecting arguments raised by Weitzman (2011) (see footnote 54) and Pindyck (2011) (see footnote 55) regarding the treatment of right-skewed probability distributions of the SCC in cost-benefit analyses. (see footnote 56) Their argument calls for full consideration of low probability, high-cost climate damage scenarios in cost-benefit analyses to more accurately reflect risk. A value of $104 per tonne does not, however, reflect the extreme end of SCC estimates, as some studies have produced values exceeding $1,000 per tonne of carbon emitted.
The interdepartmental working group on SCC also concluded that it is necessary to continually review the above estimates in order to incorporate advances in physical sciences, economic literature, and modelling to ensure the SCC estimates remain current. Environment Canada will continue to collaborate with the federal technical committee and outside experts to review and incorporate as appropriate new research on SCC in the future.
Figure 5: SCC Estimates (2010 Canadian Dollars/tonne)
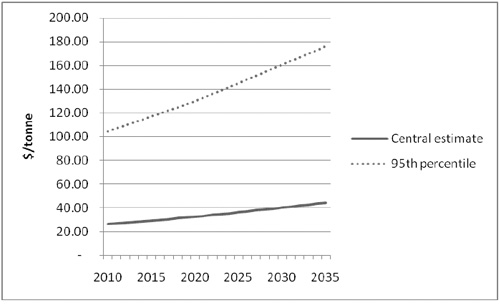
Based on this estimate, the present value of the incremental GHG emission reductions from the utility sector under the Regulations is estimated to be $5,634 million (Table 15).
7.4.2 Benefits from CAC reductions
Presented below are CAC reductions and the associated health and environmental benefits.
Criteria air contaminant reductions
Criteria air contaminants are a group of air pollutants that include sulphur oxide (SOx), nitrogen oxides (NOx), particulate matter (PM); volatile organic compounds (VOC), carbon monoxide (CO) and ammonia (NH3) and ground-level ozone (O3). These air pollutants are associated with smog formation, acid rain, and a wide range of health outcomes.
The generation of electricity is from coal-fired power plants is a contributor to emissions of CACs in Canada. As a result of the Regulations, the following are the most significant cumulative changes to electricity generation in Canada over the period 2015 to 2035:
- Coal-fired electricity generation is projected to decline by 337 TWh (net of a 38 TWh increase in CCS generation).
- Natural gas generation is projected to increase by 256 TWh.
CAC emissions from electricity generation using natural gas and coal with CCS are significantly lower than coal-fired generation, which results in fewer CAC emissions under the regulatory scenario. The CAC emissions (and resulting changes) are determined using emissions coefficients based on the 2009 National Pollutant Release Inventory (NPRI). The coefficients are determined by dividing a specific emission for 2009 by an economic driver for 2009 (e.g. volume of fuel used or volume of output). The coefficient is then multiplied by future output (volume of fuel used or volume of output) to determine the projected emission levels and resulting changes. (see footnote 57)
Nationally, the Regulations are expected to lead to a reduction in CACs from the electricity sector. Table 16 shows the cumulative changes over 2015 to 2035 (in absolute terms) which correspond to the following changes over time (in percentage terms):
Table 16: Cumulative Changes in CAC Emissions
| Criteria air contaminant |
2015–2035 |
Change |
|---|---|---|
Sulphur oxides (SOx) |
-1 156 |
-21.7% |
Nitrogen oxides (NOx) |
-546 |
-10.0% |
Particular matter (TPM) |
-71 |
-14.3% |
Particular matter <10 microns (PM10) |
-24 |
-8.3% |
Carbon monoxide (CO) |
-48 |
-3.7% |
Particular matter <2.5 microns (PM2.5) |
-9 |
-4.3% |
The geographic distribution of the cumulative changes is shown in Figure 6. The proportional differences between provinces are largely determined by the amount of coal-fired generation displaced, the type of coal that would have been burned, and the type of replacement generation. In general, by far the biggest decline in harmful CACs would occur in Alberta, with the exception of TPM where Saskatchewan would experience the greatest drop in emissions.
Figure 6: Distribution of Cumulative Reductions in CAC Emissions, 2015–2035

Coal mining and natural gas sectors
The change in electricity generation would also impact the emissions from the coal mining and natural gas (distribution and pipeline) sectors. However, the changes in these emissions are significantly smaller than those from the electricity sector. An analysis prepared by Environment Canada indicated these potential emission changes represent less than 1% of the total emissions from the electricity power sector. In addition, since the emission impacts occur in opposite directions (e.g. reductions in emissions from coal mining, increases from natural gas extraction and transportation), the net effect would be even smaller. As a result, these impacts were excluded from the analysis.
Air quality and benefit estimation modelling
To estimate how these emission reductions would impact human health and the environment, Environment Canada began by using A Unified Regional Air-quality Modelling System (AURAMS) model to predict how the emission changes would affect local air quality. This is a fully three-dimensional state-of-the-art numerical model described in peer-reviewed scientific literature. AURAMS combined the information on predicted emission changes, with information on wind speed and direction, temperatures, humidity levels, and existing pollution levels, in order to predict how these emissions changes would impact local air quality.
The AURAMS air quality modelling system was run for two years and four scenarios of anthropogenic emissions representing two different projection years: two scenarios (one for the BAU and the other for the regulatory scenario) were run for the year 2020, and the other two scenarios were run for the year 2030 to provide ambient air concentration of pollutants. The meteorological data used for these four scenarios was for the year 2006 and was generated by Environment Canada’s weather forecast model.
The ambient air concentration results were then used to estimate the incremental health and environmental benefits for those two years using the Air Quality Benefits Assessment Tool (AQBAT) and the Air Quality Valuation Model (AQVM2). However, in order to estimate the benefits for all the years between 2015 and 2035, linear interpolation and extrapolation techniques were used. More specifically, for the 2015–2020 period, benefits were assumed to be null in 2015–2017, as no change in air quality was expected, and interpolated linearly up to the 2020 value. For the 2020–2025 period, benefits were assumed to remain constant at the 2020 level as the air quality was not expected to improve significantly. For the 2025–2030 period, benefits were interpolated linearly between 2025 and 2030 values. Finally, benefits were assumed to remain constant between 2030 and 2035. Whenever the benefits were assumed to remain constant, estimates were adjusted to account for changes in population and base data. Note that this assumption provides conservative estimates for health and environmental benefits as the reductions in CACs are expected to increase over time due to more coal-fired unit retirements.
Health benefits
When addressing impacts of air pollution on human health, the most important air quality improvements are the reductions in ambient PM2.5 and ozone levels. Note that the reductions in ambient PM levels are due in large part to the reduction in precursor pollutants, such as NOx and SOx. Both NOx and SOx interact with the atmosphere in order to create PM. While the primary PM emissions from the electricity sector are important, it is the secondary PM formation resulting from NOx and SOx emissions, which has the greatest human health impact.
Average ambient air quality improvements
The largest improvements in air quality are expected to occur in Alberta, Saskatchewan, and Manitoba (Table 17). This is true for both particulate matter and ozone. For ozone, the air quality improvements are somewhat more spread out, but the Prairies still dominate.
While some areas will certainly experience greater air quality improvements than others, at a provincial level, air quality is expected to improve across almost all provinces. Air quality improvements experienced by typical residents in each province for 2030 are shown in Table 17. The Regulations are not expected to have any noticeable incremental change in concentrations of air pollution in British Columbia, the Northwest Territories, Yukon or Nunavut. For this reason, they are not included in the table.
Table 17: Estimated Average (see footnote 58) Provincial
Air Quality Improvements in 2030
| Region |
Projected Population |
PM 2.5 Levels |
Annual Ozone Levels (Population Weighted) |
||||
|---|---|---|---|---|---|---|---|
| BAU (ug/ |
Regulations (ug/m3) |
Percent Reduction |
BAU (ppm) |
Regulations |
Percent Reduction |
||
NL |
490 575 |
2.288 |
2.275 |
0.56% |
31.562 |
31.519 |
0.14% |
PEI |
160 695 |
4.227 |
4.215 |
0.26% |
32.229 |
32.192 |
0.12% |
NS |
975 819 |
2.888 |
2.879 |
0.33% |
32.823 |
32.781 |
0.13% |
NB |
765 669 |
2.303 |
2.3 |
0.13% |
32.171 |
32.158 |
0.04% |
QC |
9 093 237 |
6.794 |
6.792 |
0.02% |
31.976 |
31.971 |
0.02% |
ON |
16 511 597 |
7.049 |
7.045 |
0.06% |
35.848 |
35.84 |
0.02% |
MB |
1 453 742 |
3.75 |
3.681 |
1.84% |
31.672 |
31.587 |
0.27% |
SK |
1 109 721 |
2.884 |
2.757 |
4.39% |
34.349 |
34.158 |
0.56% |
AB |
5 290 803 |
5.713 |
5.579 |
2.36% |
37.891 |
37.695 |
0.52% |
| Total |
35 851 858 |
6.232 |
6.203 |
0.47% |
34.716 |
34.671 |
0.13% |
Improved health outcomes
The human health impacts and resulting socio-economic benefits are highly dependent on population proximity to the source of coal-fired electricity generation emissions. It is the population exposure to changes in air quality, and not simply the absolute changes in PM and ozone levels, which determines the health benefits of the Regulations. For this reason, the areas that experience the largest health benefits, and the areas that experience the largest air quality improvements, are not necessarily the same.
The health benefits covered by the analysis include a wide range of health outcomes linked with air pollution. These range from health outcomes such as asthma episodes and minor breathing difficulties to much more serious impacts such as visits to the emergency room and hospitalization for respiratory or cardiovascular problems. Air pollution also increases the average per capita risk of death. While the changes in individual risk levels are small, these individual risk reductions translate into large social benefits.
Table 18 shows some of the estimated changes in cumulative health outcomes as a result of the Regulations. The table also shows the estimated total present value of the improvement in social welfare, expressed in economic (dollar) terms, for all avoided health impacts over 2015–2035. (see footnote 59) The present value of the health benefits is estimated at $4.2 billion, with the largest benefits in Alberta (65%), followed by Saskatchewan (15%) and Manitoba (9%). The PM2.5 reductions account for more than 69% of the health benefits from the Regulations in 2030, while ozone improvements account for 26%.
Table 18: Cumulative Avoided Health Impacts, 2015 to 2035,
Selected Health Outcomes (see footnote 60)
| Region |
Premature Mortality |
Emergency Room Visits and Hospitalization |
Asthma Episodes |
Days of Breathing Difficulty and Reduced Activity |
|---|---|---|---|---|
Canada |
900 |
800 |
120 000 |
2 700 000 |
Newfoundland and Labrador |
10 |
9 |
1 200 |
21 000 |
Prince Edward Island |
2 |
2 |
280 |
4 600 |
Nova Scotia |
11 |
9 |
1 200 |
19 000 |
New Brunswick |
3 |
3 |
450 |
6 400 |
Quebec |
18 |
18 |
2 700 |
47 000 |
Ontario |
57 |
49 |
7 000 |
170 000 |
Manitoba |
80 |
68 |
9 000 |
240 000 |
Saskatchewan |
140 |
110 |
15 000 |
360 000 |
Alberta |
590 |
520 |
80 000 |
1 900 000 |
| Region |
Present Value in 2015 of Total |
||
|---|---|---|---|
| Ozone related |
PM 2.5 related |
Total |
|
Canada |
$1,100 |
$2,900 |
$4,200 |
Newfoundland and Labrador |
$19 |
$26 |
$46 |
Prince Edward Island |
$4 |
$5 |
$9 |
Nova Scotia |
$23 |
$24 |
$49 |
New Brunswick |
$7 |
$7 |
$13 |
Quebec |
$35 |
$50 |
$84 |
Ontario |
$75 |
$190 |
$260 |
Manitoba |
$88 |
$290 |
$380 |
Saskatchewan |
$160 |
$440 |
$630 |
Alberta |
$680 |
$1,900 |
$2,700 |
The Regulations are not expected to have any noticeable incremental change in concentrations of air pollution in British Columbia, the Northwest Territories, the Yukon or Nunavut. As a result, no incremental health impacts are expected for these regions.
Mercury reductions from the electricity sector
Mercury is a heavy metal that can be released into the environment as a result of human activity (i.e. primarily anthropogenic), including through the combustion of coal. The largest anthropogenic source of mercury emissions in Canada is from electric power generation plants, which represented approximately 30% of emissions in 2007.
Once in the environment, mercury can be converted to various forms. For example, mercury can be transformed into a highly toxic compound called methyl mercury, which can accumulate in living organisms and biomagnify (i.e. increase in concentration) as it moves up the food chain. This is the form of mercury to which humans are most often exposed, primarily through consumption of fish and other seafood.
Human exposure to mercury can result in a number of health effects such as intellectual quotient (IQ) loss, memory loss and even death. Studies have examined the link between exposure to mercury and IQ effects. Neurological damage resulting in impaired prenatal brain development can lead to reduced IQ points, with associated costs for the individual and society stemming from direct and indirect loss of productivity, earnings and education, and well-being.
The Regulations are estimated to result in a cumulative reduction of 6 686 kg of mercury released to the environment over the period 2015–2035 compared to the BAU scenario (Table 19). The majority of these reductions are forecast to occur in Alberta (54%) followed by Saskatchewan (38%) and Nova Scotia (8%).
Several studies in the economic literature have estimated and monetized the socio-economic value of mercury-related health impacts. Rice and Hammit (2005) estimated the value of health benefits from proposed caps on mercury emissions from U.S. power plants. With respect to the impacts of mercury on brain development, Rice and Hammit estimated that IQ impacts had a value of $10,000 to $11,000 per kg of emissions, assuming that there is no lower threshold for impacts from exposure. If a non-zero threshold of impacts is assumed, then Rice and Hammit estimate the value of impacts to be lower at $3,900 to $4,500 per kg (in 2000 U.S. dollars).
More recently, Spadaro and Rabl (2008) estimated the global impacts of global mercury emissions on brain development. Because of their global focus, Spadaro and Rabl estimated a much lower value of health impacts per kg of mercury emissions. However, when applying the same methodology used in their study to U.S. data, they came up with results that were nearly identical to the results of Rice and Hammit.
Given the similar results in both of these studies and in the absence of primary Canadian research, the results from Rice and Hammit were adopted for use in this analysis. (see footnote 63)
To be conservative, the low value of US$3,900 per kg of emissions is used for the analysis. Adjusting the value of $3,900 in 2000 U.S. dollars gives a value of $5,880 in 2010 Canadian dollars. Applying this value to measure the benefits of the 6 686 kg of mercury expected to be reduced under the Regulations gives a present value of $24 million (Table 19).
Table 19: Present Value (PV) of Mercury Reductions
| Region |
Cumulative 2015–2035 (kg) |
PV (see footnote 64) |
|---|---|---|
SK |
-2 571 |
9 |
AB |
-3 607 |
13 |
NS |
-524 |
2 |
| Canada |
-6 686 (see footnote 65) |
24 |
Note that the discussion and the values estimated above apply only to the neurological impacts of mercury exposure and the resulting impacts on IQ. There is emerging scientific evidence that mercury is also a factor in heart disease and the risk of premature death. The inclusion of a potential heart disease and mortality linked to mercury would result in a significant increase in the estimated benefits of the mercury reductions. For example, when Rice and Hammit (2005) include heart disease and mortality risks in their analysis, they find the value of health benefits from mercury reductions increases nearly 50 times, to over $180,000 per kg. Due to uncertainty in the quantification of these impacts, they have not been included in this analysis. However, given the omission of these potentially significant impacts, the benefit estimate should be seen as a low-end estimate of the value of potential health impacts from mercury.
Lead reductions from electricity sector
In terms of health impacts, the developmental neurotoxicity endpoint that has been most studied and for which there is the greatest weight of evidence of a causal relationship is the adverse consequence of early life lead exposure (children under the age of six) on psychometric tests of intelligence (IQ)among school-aged children.
When lead exposure affects IQ, it translates into foregone future earnings/productivity as affected individuals cannot work to their full potential at their usual employment when they reach adulthood.
Studies have shown that some effects of chronic lead exposure may also occur in adulthood. Coronary heart disease, hypertension and strokes are among the main adult human health endpoints that have been quantified in previous economic analyses.
Although some health benefits are expected, they were not estimated due to data limitations.
Environmental benefits
The reductions in CAC emissions from the Regulations will also result in environmental benefits. These have been estimated mainly using Environment Canada’s Air Quality Valuation Model (AQVM2), (see footnote 66) and supplemented with other environmental estimates in an attempt to incorporate benefits not addressed by AQVM2.
Estimate for soiling, visibility and agriculture
The ambient air quality was modelled for years 2020 and 2030 only. In order to generate annual estimates of benefits, different assumptions were applied depending on the expected trend in ambient air quality during a specific time period as discussed above. Over 2015 to 2035, the total present value of benefits estimated with AQVM2 is estimated at $149.9 million. Additional benefits, worth $11.5 million, are estimated using a benefit transfer approach. Therefore, the environmental benefits resulting from CAC emission reductions for Canada are estimated to be approximately $161.4 million. The benefit estimates resulting from the AQVM2 model are shown in Table 20 and discussed below. The environmental impacts due to the Regulations were considered to be negligible for the province of British Columbia and the territories. Therefore, these estimates were excluded from the table and the Canadian total.
Table 20: Cumulative Environmental Benefits for Canada (2015–2035),
Present Value in Millions of 2010 Dollars
| Region |
Soiling on Households |
Visibility on Households |
Ozone on Agriculture Revenues |
Total AQVM2 |
|---|---|---|---|---|
Newfoundland and Labrador |
0.1 |
1.1 |
0.0 |
1.2 |
Prince Edward Island |
0.0 |
0.2 |
0.0 |
0.2 |
Nova Scotia |
0.0 |
0.8 |
0.1 |
1.0 |
New Brunswick |
0.0 |
0.4 |
0.0 |
0.4 |
Quebec |
0.2 |
1.1 |
0.6 |
1.8 |
Ontario |
0.6 |
2.4 |
2.2 |
5.2 |
Manitoba |
1.1 |
6.0 |
5.4 |
12.5 |
Saskatchewan |
1.8 |
9.8 |
34.6 |
46.2 |
Alberta |
7.4 |
25.0 |
48.9 |
81.3 |
Canada |
11.2 |
46.9 |
91.9 |
149.9 |
| Environmental benefits estimated via AQVM2 |
149.9 |
|||
| Additional environmental benefits estimated via benefit transfer |
11.5 |
|||
| Total of estimated environmental benefits |
161.4 |
|||
Reduced soiling
Soiling from increased deposition of PM results in cleaning expenditures for Canadian households. The Soiling Cleaning Savings Impacts Estimator (SCSIE) model estimates the avoided cleaning costs for Canadian households associated with different levels of PM10. Over 2015 and 2035, the present value of avoided cleaning costs is expected to be $11.2 million. This estimate may be regarded as conservative as it is limited to the residential sector and does not account for cleaning expenditures in the commercial and institutional sectors. The two provinces with the highest reductions in coal-fired electricity generation, Alberta and Saskatchewan, also exhibit the largest gains from reduced soiling.
Improved visibility
All else being constant, visibility increases as ambient concentrations of particulate matter decrease. Based on willingness to pay for improved visual range, the VIEW R2 (Visibility Impacts Estimator of Welfare for Residents) model estimates the monetary change in welfare for different levels of deciviews. (see footnote 67) The present value of welfare gains from improved visibility in the residential sector are expected to be $46.9 million, with Alberta and Saskatchewan combining 74% of total benefits.
Increased agriculture productivity
The Regulations are expected to result in decreased ambient concentrations of tropospheric ozone. Based on exposure-response functions for 20 different crops, the Value of Ozone Impacts on Canadian Crops Estimator (VOICCE) model provides the change in production (tonnes) and total value of crops per Census Agricultural Region due to changes in levels of ozone. National benefits from increased agricultural productivity, expressed in present value, are expected to be $91.9 million. (see footnote 68) Saskatchewan receives about 37% of the national benefits, while Alberta receives more than half.
Additional estimations for timber harvest, recreational use of forests, and material maintenance costs
To address additional environmental benefits that are not considered in AQVM2, a benefit transfer approach was developed to assess the economic impacts of NOx on timber harvests and recreational use of forest ecosystems, and SO2 on material maintenance costs. The mean marginal damages per tonne estimates derived from Muller and Mendelsohn (see footnote 69) were multiplied by the national annual reductions in NOx and SOx emissions. The present value of the benefits associated with these emission reductions is about $11.5 million for Canada.
Other environmental benefits
Overall, the present value of the environmental benefits is expected to be $161.4 million. This impact may be regarded as conservative since many environmental benefits remain non-quantified due to data or methodological limitations. Amongst these benefits are the omitted benefits of reduced soiling to the industrial and commercial sectors, additional recreational benefits of visibility improvement, the beneficial impact of reduced mercury and acid deposition on ecosystems (e.g. on water or forests), and the benefits of lower levels of PM2.5 and ozone on livestock and wildlife premature mortalities and illnesses.
7.4.3 Oil extraction from enhanced oil recovery
One of the benefits of the Regulations is the ability to use the CO2 captured from CCS plants for EOR. EOR is a process in which CO2 is injected into existing oil reservoirs to extract more oil. For the central case, oil has been valued at the forecasted price of WTI from E3MC, and it has been assumed that the use of one tonne of CO2 for EOR results in three incremental barrels of oil production. The present value of the benefits from incremental oil production due to the Regulations is estimated to be $6,098 million over the 2015–2035 timeline.
7.5 Cost-benefit statement
The results of the cost-benefit analysis are summarized in Table 21. Each key variable is presented in the net present values, both in five-year increments as well as the total over the entire study period. The values have been discounted at 3% and are categorized into terms of quantified and monetized costs (generation, increased imports, reduced exports, government) and quantified and monetized benefits (avoided generation costs, environmental benefits and health benefits). The values shown for new capital and refurbishment are net of their residual value to ensure only the part of their costs and benefits amortized within the study period were included. The NPV measures the net benefits (benefits minus costs), for all years indicated.
The NPV of the Regulations in 2015 over the study period is estimated at $7.3 billion. The present value of benefits is estimated at $23.3 billion, largely due to the avoided SCC of carbon ($5.6 billion), avoided generation costs ($7.2 billion), health benefits from reduced smog exposure ($4.2 billion), and additional oil extracted through enhanced oil recovery ($6.1 billion).
The present value of costs is estimated at $16.1 billion, largely due to incremental purchase of natural gas fuel ($8.0 billion), reduced electricity exports and new capital costs ($0.3 billion and $1.9 billion respectively).
Table 21: Incremental Cost-Benefit Statement (2015–2035)
(Millions of 2010 dollars)
| Category |
2015 |
2020 |
2025 |
2030 |
2035 |
Total |
|---|---|---|---|---|---|---|
| A. Quantified costs |
||||||
| A1. Generation costs |
||||||
New capital (net of residual value) |
0 |
68 |
1,406 |
2,145 |
-4,063 |
1,946 |
Decommissioning of coal units |
0 |
39 |
0 |
210 |
0 |
329 |
Additional fixed O&M |
0 |
2 |
7 |
28 |
38 |
250 |
Additional variable O&M |
0 |
129 |
99 |
344 |
465 |
3,810 |
Natural gas fuel costs |
0 |
155 |
153 |
881 |
1,091 |
7,954 |
| Subtotal |
0 |
393 |
1,664 |
3,608 |
-2,468 |
14,289 |
| A2. Enhanced Oil Recovery |
||||||
Oil extraction costs |
0 |
0 |
84 |
146 |
126 |
1,288 |
Additional social cost of carbon (central estimate) |
0 |
0 |
8 |
16 |
15 |
140 |
| Subtotal |
0 |
0 |
92 |
162 |
141 |
1,427 |
| Increased imports |
0 |
0 |
3 |
10 |
4 |
72 |
| Reduced exports |
0 |
-1 |
18 |
48 |
25 |
274 |
| Government costs |
1 |
1 |
1 |
0 |
0 |
11 |
| TOTAL COSTS |
1 |
393 |
1,778 |
3,828 |
-2,298 |
16,073 |
| B. Quantified benefits |
||||||
| B1. Avoided generation costs |
||||||
Capital costs (net of residual value) |
0 |
0 |
170 |
39 |
-2,690 |
1,195 |
Refurbishment of coal units (net of residual value) |
0 |
160 |
88 |
867 |
-842 |
684 |
Fixed O&M |
0 |
4 |
22 |
105 |
110 |
833 |
Variable O&M |
0 |
22 |
30 |
112 |
131 |
1,032 |
Coal fuel costs |
0 |
78 |
85 |
420 |
371 |
3,494 |
| Subtotal |
0 |
265 |
395 |
1,543 |
-2,920 |
7,237 |
| B2. Environmental benefits |
||||||
Avoided social costs of carbon (central estimate) |
0 |
87 |
134 |
645 |
742 |
5,634 |
Soiling, visibility, agriculture, timber and recreation |
0 |
1 |
2 |
19 |
17 |
161 |
| Subtotal |
0 |
88 |
136 |
664 |
759 |
5,796 |
| B3. Health benefits |
||||||
Benefits of reduced levels of smog |
0 |
21 |
21 |
485 |
504 |
4,185 |
Mercury |
0 |
0 |
1 |
3 |
3 |
24 |
| Sub-total |
0 |
22 |
21 |
489 |
507 |
4,210 |
| B3. Enhanced Oil Recovery |
||||||
Oil extraction valued at WTI |
0 |
0 |
381 |
691 |
614 |
6,098 |
| Sub-total |
0 |
0 |
381 |
691 |
614 |
6,098 |
| TOTAL BENEFITS |
0 |
374 |
933 |
3,387 |
-1,040 |
23,341 |
| E. NET PRESENT VALUE |
-1 |
-19 |
-844 |
-441 |
1,258 |
7,267 |
The table below reports some corresponding key summary metrics for the cost-benefit analysis. The socio-economic cost per tonne of GHG shows that the non-GHG benefits exceed the costs. (see footnote 70) The benefits of the Regulations are estimated to be 45% greater than the cost.
Table 22: Summary Metrics (2015–2035)
| Category |
2015 |
2020 |
2025 |
2030 |
2035 |
Total |
|---|---|---|---|---|---|---|
Reductions in GHG emissions from the utility sector (Mt CO2e) |
0.0 |
3.1 |
4.9 |
24.9 |
30.1 |
219.2 |
Increases in GHG emissions associated with EOR (Mt CO2e) |
0.0 |
0.0 |
0.3 |
0.6 |
0.6 |
5.4 |
Net reductions in GHG emissions (Mt CO2e) |
0.0 |
3.1 |
4.6 |
24.3 |
29.5 |
213.8 |
| Benefit-to-cost ratio |
1.452 |
|||||
| Socio-economic cost per adjusted tonne of GHG ($/tonne) |
-7.85 |
|||||
7.6 Sensitivity analysis
7.6.1 Univariate sensitivity
A sensitivity analysis was conducted on key variables to test the impacts of uncertainty on the results. This requires changing one variable at a time (while holding all other variables/impacts constant). The sensitivity analysis (presented in table 23) shows that the results are robust in terms of demonstrating a positive net present value for the Regulations across a broad range of plausible values for variables and assumptions. The results were most sensitive to varying the discount rate, using the avoided SCC at the 95th percentile estimate, the assumption around the amount of CO2 sold for EOR, and changes in the oil price forecasts.
Table 23: Results of Sensitivity Analysis
(Millions of 2010 Dollars)
| Sensitivity variables |
NET PRESENT VALUE |
||
|---|---|---|---|
| Lower |
Central |
Upper |
|
1. Discount rate: 7%, 0% |
4,669 |
7,267 |
13,530 |
2. Sensitivity to natural gas price forecast: +20%, -20% |
6,813 |
7,267 |
9,995 |
3. Sensitivity to coal price forecast: -20%, +20% |
7,705 |
7,267 |
9,103 |
4. Refurbishment of end-of-useful-life coal-fired units — 50% |
7,641 |
7,267 |
n/a |
5. Decommissioning costs: +50%, -50% |
8,240 |
7,267 |
8,568 |
6. Amount of captured CO2 that is sold to EOR: 50% less than central case |
4,901 |
7,267 |
n/a |
7. Sensitivity to oil prices: -40%, +40% |
5,965 |
7,267 |
10,844 |
8. Avoided SCC at the 95th percentile estimate |
n/a |
7,267 |
23,088 |
7.6.2 Scenario analysis
Scenario analysis was also undertaken using Environment Canada’s E3MC model. As the E3MC model is dynamic in nature, a change in one parameter will have impacts on several variables. While the natural gas price was the focal point of the sensitivity analysis, varying the natural gas price influenced economic growth and consumer electricity demand.
Natural gas price sensitivity
Many of the events that shape energy markets cannot be anticipated. Projected energy prices are subject to uncertainty, and are most appropriately analyzed as a range of plausible outcomes. To get a sense of the sensitivity of consumer price impacts to future natural gas prices, these impacts were calculated under a series of alternative assumptions about the future price of natural gas at Henry Hub (Figure 7).
Figure 7: Sensitivity Range of Natural Gas Prices at Henry Hub

The reference price scenario, developed by the National Energy Board, was designed to incorporate the best available information about energy demand and supply into the future. The projections also reflect assumptions regarding pipeline expansions (e.g. Mackenzie and the Alaska pipelines) as well as potential evolutions in natural gas supply and demand in the United States. Under the reference scenario, the natural gas price is projected to increase from about $4.37/MCF (in real 2010 U.S. dollars) to about $8/MCF by 2035. Under the alternative scenarios, the natural gas price in 2035 is expected to be some $7.75/MCF in the low scenario; and some $10.50/MCF in the high scenario. As noted in section 7.2.2, these projections on the future price of natural gas are considered conservative.
As shown in Table 24, variations in the projected price of natural gas at Henry Hub have an impact on the expected prices for natural gas powered electricity generation. These in turn will affect consumer electricity prices in varying proportions across Canada depending on factors such as the overall mix of generating sources in the region’s electricity portfolio.
In Alberta, electricity generator natural gas prices could be as low as $6.05/thousand cubic feet (Mcf) or as high as $9.95/Mcf under the range of sensitivity cases in 2035. These prices are relatively low compared to other Canadian provinces. For example, electricity generator natural gas prices could reach as high as $14.07/Mcf, or fall only as low as $10.18/Mcf in Nova Scotia where prices are expected to be the highest across the selected provinces.
Table 24: Electricity Generator Natural Gas Prices — Selected Provinces
(¢/kWh — 2010 Dollars)
Region |
2009 |
2025 |
Reference |
High |
2035 |
Reference |
High |
|---|---|---|---|---|---|---|---|
Alberta |
3.30 |
5.10 |
5.90 |
7.69 |
6.05 |
7.33 |
9.95 |
Saskatchewan |
5.54 |
7.55 |
8.35 |
10.15 |
8.51 |
9.78 |
12.40 |
Nova Scotia |
7.06 |
9.22 |
10.02 |
11.81 |
10.18 |
11.45 |
14.07 |
The alternative natural gas price has an impact on the cost of power. Table 25 illustrates the impact of alternative natural gas prices on the cost of producing electricity from combined cycle natural gas units. In Alberta, the cost of power for natural gas combined cycle units in 2035 could be as low as 8.77¢/kWh in 2035 or as high as 11.39¢/kWh under the range of sensitivity cases. These prices are relatively low compared to other Canadian provinces. For example, cost of power for natural gas combined cycle units could reach as high as 13.99¢/kWh, or fall only as low as 11.42¢/kWh in Nova Scotia where prices are expected to be the highest across the selected provinces.
Table 25: Cost of Power for Natural Gas Combined Cycle Units — Selected Provinces (¢/kWh — 2010 Dollars)
Region |
2009 |
2025 |
Reference |
High |
2035 |
Reference |
High |
|---|---|---|---|---|---|---|---|
Alberta |
6.21 |
8.36 |
8.93 |
10.17 |
8.77 |
9.63 |
11.39 |
Saskatchewan |
5.56 |
9.60 |
10.20 |
11.64 |
10.54 |
11.47 |
13.34 |
Nova Scotia |
0.00 |
9.35 |
10.41 |
12.20 |
11.42 |
12.03 |
13.99 |
As previously noted, the E3MC model is dynamic in nature and a change in price will influence economic growth and consumer demand. As illustrated in Table 26, the lower natural gas price results in a higher average annual growth rate relative to the reference case, while the higher natural gas prices results in a lower average annual growth rate relative to the reference case. In Alberta, the average annual growth rate for the 2010 to 2035 period is 2.85% with a low natural gas price compared to 2.83% under the reference price and 2.79% with the high natural gas price.
Table 26: Provincial Gross Domestic Product (Average Annual Growth Rate)
Region |
2010 to 2025 |
Reference |
High Price |
2010 to 2035 |
Reference |
High Price |
|---|---|---|---|---|---|---|
Alberta |
3.21% |
3.09% |
2.93% |
2.85% |
2.83% |
2.79% |
Saskatchewan |
2.53% |
2.43% |
2.29% |
2.27% |
2.24% |
2.19% |
Nova Scotia |
1.65% |
1.55% |
1.42% |
1.52% |
1.52% |
1.49% |
There are many factors that contribute to the formation of consumer electricity prices (e.g. market structure, unit dispatch order and supply/demand conditions), including alternative natural gas prices. These factors have different influences depending on the structure of the electricity market. For example, in Alberta, supply/demand factors and the contribution of natural gas-fired generation to meeting hourly demand tend to outweigh the simple contribution of the natural gas price.
Table 27 illustrates the impact of alternative natural gas prices on average electricity prices. In Alberta, the average electricity price in 2035 could be as low as 18.16¢/kWh or as high as 18.67¢/kWh under the range of sensitivity cases. (see footnote 71) Saskatchewan varies between 20.13¢/kWh and 21.55¢/kWh while Nova Scotia varies from 22.36¢/kWh to 23.40¢/kWh.
Table 27: Average Electricity Prices After the Electricity Performance Standard — Selected Provinces (¢/kWh – 2010 Dollars)
Region |
2009 |
2025 |
Reference |
High |
2035 |
Reference |
High |
|---|---|---|---|---|---|---|---|
Alberta |
7.57 |
16.14 |
16.36 |
14.83 |
18.44 |
18.67 |
18.16 |
Saskatchewan |
9.85 |
14.60 |
14.71 |
15.08 |
20.13 |
20.58 |
21.55 |
Nova Scotia |
12.44 |
18.58 |
18.74 |
19.67 |
22.36 |
22.43 |
23.40 |
7.7 Distributional and competitiveness analysis
7.7.1 Coal sector
The Regulations are expected to affect employment in terms of the closure of coal-fired electricity generating facilities and coal mining facilities. However, employment impacts vary significantly across Canada. As Saskatchewan’s response to the Regulations is to retrofit their coal units with CCS technology, employment impacts are expected to be minimal as the province continues to use its coal resource for electricity generation. Similar impacts are expected in Nova Scotia and New Brunswick as they are dependent on imports of coal for electricity generation.
In Alberta, some employment impacts are expected to occur as 10 coal-fired electricity generating facilities are expected to shut down over the 2015–2035 period. The coal produced in Alberta is unlikely to be demanded in export markets and therefore it is anticipated that the associated production of coal would cease. Furthermore, there are certain regions which are heavily dependent on coal-fired electricity generating facilities and coal mining for direct employment and the indirect jobs associated with the facilities and mines. While employment at natural gas-fired facilities would offset some of the resulting employment losses, natural gas facilities would require fewer employees to operate than coal-fired facilities and associated coal mines.
The employment impacts are considered to be transitional as the unemployed are expected to eventually find new jobs within the economy. For instance, the Alberta government (Alberta Employment and Immigration) has recently estimated that by 2019 there will be a cumulative shortage of 77 000 workers in the province, while the first coal-fired electricity generating facilities projected to shut down in Alberta due to the Regulations are not expected to close until 2020. In sum, transition costs are expected to be minimal or moderate.
It is also important to note that the Regulations could spur innovation in the electricity sector and other sectors of the economy. For example, the costs of adopting CCS technology over time could diminish due to “learning by doing,” which could benefit other sectors of the economy that are able to adopt the technology. The Regulations could also drive demand for clean technologies, energy efficiency and renewable energy. Induced technological change could contribute to reducing further GHG emissions while producing economic co-benefits such as new job opportunities in the clean technology sector, and new skills and technologies that could support Canadian firms in a growing global market for clean technologies.
7.7.2 Natural gas sector
The North American gas market is a highly competitive market, in which natural gas can be bought from many supply sources and delivered to any market centre through an extensive North American pipeline grid. The price of gas is set by market fundamentals such as industrial demand, production levels of gas, and high levels of natural gas in storage. Given this highly competitive market, the price of gas in one region generally differs from the price in another region only by the cost of transportation.
In 2035, the total volume of natural gas used to generate electricity would increase by approximately 40%, or by 292 petajoules (PJ) relative to the BAU.
For the CGI analysis, Environment Canada commissioned a report from Ziff Energy on the expected impacts of the proposed Regulations on the natural gas markets and prices. The report confirmed that the increased gas demand due to the proposed Regulations would not have a material impact on the functioning of the North American gas markets. More specifically, the increased demand would account for less than 1% of the overall North American market. The average yearly price impact would be less than $0.01/MMBtu over the period considered.
Given that the impact on natural gas demand under the Regulations is still below 1% of the overall North American market, it is expected that these conclusions will continue to hold.
One of the concerns identified by stakeholders relates to the impact of the Regulations on the price of natural gas and more specifically on natural gas intensive sectors. The sectors most sensitive to changes in gas prices include
- Fertilizer manufacturers (approximately 85% of input cost is natural gas);
- Chemicals sector who use gas as both a feedstock and a process fuel, which is significant in terms of overall costs;
- Pulp and paper sector for which Industry Canada estimates energy accounts for 15% of overall costs. Additionally, the U.S. Energy Information Association (EIA) estimates 50% of this sector’s energy requirements are self-generated by utilizing wood residues and by-products (black liquor).
As noted above, the study by Ziff Energy indicated that the impact of the proposed Regulations on gas prices would not be material. Therefore, the sectors above are not expected to be affected by natural gas price increases under the Regulations.
7.7.3 Residential and industrial consumers
Residential consumers
Provincial electricity prices are expected to increase in the future with or without the performance standard. In Alberta, price increases in the BAU reflect a shift toward natural gas playing a larger role in setting the hourly price in the Alberta wholesale market. The performance standard will accelerate this shift somewhat. The phase-in of the performance standard is such that any impact on prices is deferred until well out into the future. Over time, the performance standard is expected to have the greatest impacts on electricity prices in Alberta, Saskatchewan, and Nova Scotia. The estimated impact on prices in these provinces is presented below. Note that changes are expected to be small for other provinces and, consequently, they are not included in the table below.
Table 28: Absolute Change in Residential Electricity Prices as a Result of the Electricity Performance Standard (Cents/kWh — 2010 Dollars)
Region |
2015 |
2020 |
2025 |
2030 |
2035 |
Average Annual Change 2015–2035 |
|---|---|---|---|---|---|---|
Nova Scotia |
0.00 |
0.00 |
1.31 |
1.27 |
1.40 |
0.76 |
Saskatchewan |
0.00 |
0.00 |
0.09 |
0.85 |
2.50 |
0.74 |
Alberta |
0.00 |
1.66 |
1.96 |
2.24 |
2.12 |
1.61 |
It is expected that the price increases from the Regulations will be passed on to consumers in proportion to their consumption. Allocating the prices in Table 28 to the 2007 residential customer using average consumption (Nova Scotia uses 10 380 kWh, Saskatchewan uses 9 850 kWh, and Alberta uses 5 810 kWh), gives the following estimated average monthly increases in each of the provinces from 2015 to 2035:
- Alberta — $7.80
- Nova Scotia — $6.60
- Saskatchewan — $6.05
Households that consume more (or less) than the average would pay proportionately more (or less) of the total costs.
While households could experience higher electricity cost, the share of household electricity costs relative to disposable income is expected to remain relatively constant. The share remains relatively flat over the 2015–2035 period of the performance standard analysis for all three of the affected provinces.
Table 29: Share of Household Electricity Costs Relative to
Disposable Income (see footnote 72)
Region |
2010 |
2015 |
2020 |
2025 |
2030 |
2035 |
|---|---|---|---|---|---|---|
Nova Scotia |
2.9% |
2.8% |
2.8% |
2.9% |
2.9% |
2.7% |
Saskatchewan |
1.9% |
1.8% |
1.7% |
1.8% |
1.8% |
1.8% |
Alberta |
1.0% |
1.3% |
1.3% |
1.3% |
1.4% |
1.3% |
Industrial consumers
In terms of cents/kWh, price impacts for commercial and industrial consumers of electricity are estimated to be very similar to the price impacts for residential consumers.
Table 30: Absolute Change in Industrial Electricity Prices as a Result of the Electricity Performance Standard (Cents/kWh — 2010 Dollars)
Region |
2015 |
2020 |
2025 |
2030 |
2035 |
Average Annual Change 2015–2035 |
|---|---|---|---|---|---|---|
Nova Scotia |
0.00 |
0.00 |
1.31 |
1.27 |
1.40 |
0.76 |
Saskatchewan |
0.00 |
0.00 |
1.07 |
0.93 |
2.81 |
0.82 |
Alberta |
0.00 |
1.66 |
1.96 |
2.25 |
2.13 |
1.61 |
The incremental price increases as presented in Table 30 are not expected to have major impacts on the industrial sector in Canada. In general, Canada has low electricity rates relative to many of its global competitors including the United States, mainly due to Canada’s natural resources, such as inexpensive hydro (i.e. water resources), and the industrial sector continues to use less energy for each unit of economic output. The long-term trend (from 1990) indicates that the amount of energy used by industry for each unit of economic output (energy intensity) dropped from 12.3 megajoules (MJ)/$ output to 10.7 MJ/$ output. (see footnote 73) It should also be noted that the U.S. EPA is moving forward with its own electricity performance standard which covers new power plants, as well as stringent new air pollution requirements, which should also have a comparative impact on electricity rates in that country.
8. Small business lens
As the regulated community consists of medium and large businesses, the small business lens does not apply to these Regulations.
9. “One-for-One” Rule
The federal government has implemented a “One-for-One” Rule to reduce administrative burden (i.e. the time and resources spent by business to show compliance with government regulations). The “One-for-One” Rule requires that regulatory changes that increase administrative burden need to be offset with equal administrative burden reductions.
These Regulations include a number of mandatory administrative requirements, such as registration, quantification and reporting, as well as requirements for a variety of flexibility mechanisms where regulatees can choose to use or not use any of these provisions. However, once a regulatee chooses to participate in a flexibility mechanism, there are mandatory requirements for participation.
These Regulations were developed with consideration of what industry already does as a way to minimize administrative burden associated with implementation. The regulated community reports the same or similar types of information to other programs and commitments, including Environment Canada’s Greenhouse Gas Reporting Program, Statistics Canada, and various provincial programs and electricity system operators. As a result, minimal incremental administrative burden is expected for emissions and electricity quantification beyond the current activities of regulatees.
There will be incremental administrative burden associated with the applications and reports for the use of the flexibility mechanisms, such as the carbon capture and storage deferral, that are unique to these Regulations. This administrative burden is, for the most part, experienced by units that continue operating and meet the performance standard. Units that close prior to meeting the performance standard will have negligible additional administrative burden.
The “One for One” Rule will be applied to the Regulations as they are expected to result in an annualized cost of $7,000 for all businesses ($350 per business) within the regulatory community.
10. Consultation
Consultations after the publication of the proposed Regulations in the Canada Gazette, Part Ⅰ
Over the past 20 months, Environment Canada has met with 23 stakeholders about 60 times and an additional 25 times with affected provinces. This includes consultations with the coal-fired electricity sector and with representatives from the governments of Alberta, Saskatchewan, Manitoba, Ontario, Nova Scotia, and New Brunswick — the provinces most reliant on coal-fired generation — as well as non-governmental organizations (NGOs). Other federal departments have also consulted with affected stakeholders.
On August 27, 2011, the Government of Canada published the proposed Reduction of Carbon Dioxide Emissions from Coal-fired Generation of Electricity Regulations. Upon publication of the proposed Regulations, a 60-day consultation period was initiated, allowing stakeholders and interested parties an opportunity to submit formal comments for consideration.
The Department also held several larger consultation sessions, including face-to-face and webinar consultations. Provincial governments, industry, NGOs and aboriginal groups were invited to participate in these sessions. These sessions provided further detail and discussion on the proposed Regulations and gave stakeholders an opportunity to explore issues of concern or clarification. These sessions were held during the 60-day consultation period in order to facilitate or aid their development of comments for formal submission.
Over 5 000 submissions were received during the 60-day consultation period, including submissions from 4 provincial governments, 16 electricity industry corporations or system operators, 17 other industry corporations or associations, and 6 NGOs. The remainder of comments came from the general public, primarily through the use of form letters available on various Web sites. Based on these comments, and subsequent discussions with industry and provinces, certain refinements have been implemented for these Regulations. These refinements will provide some greater flexibility to industry, while respecting the CGI regulatory framework and maintaining the contribution of the Regulations to Canada’s Copenhagen target.
Extensive bilateral consultations were also held with officials from the governments of Alberta, Nova Scotia and Saskatchewan and with officials from key generating companies (e.g. SaskPower, Nova Scotia Power Inc., Manitoba Hydro) focused on reviewing key technical parameters used in support of this analysis. These consultations focused on parameters ranging from heat rates and emission intensity for various generating units to alternative capital costs for new generating units.
Overall, industry stakeholders and provinces have expressed support for Canada’s commitment to reduce greenhouse gases and, in many cases, for the proposed regulated performance standard approach. There were, however, some firm questions or concerns regarding the sector-by-sector approach and how the proposed Regulations would affect specific units or align with existing provincial regulatory programs. Among the NGOs consulted, some had questions regarding the level of performance standard, exclusion of biomass, CO2 emissions and the application of CCS provisions. In terms of consulted user groups, questions were raised about the secondary impact on natural gas production and electricity prices. The following summarizes key issues raised by stakeholders throughout consultations how they are addressed in the final Regulations.
In considering possible refinements to the proposed Regulations to reflect comments received, Environment Canada was guided by the objectives set out in section 4, the importance of preserving emission reductions in 2020 so as to contribute to Canada’s Copenhagen target, and the importance of respecting the originally proposed regulatory framework.
The following sections provide a summary of the comments received from industry stakeholders, provinces and interested parties. The comments are organized into two sections: policy related and economics related.
10.1 Policy-related comments
Comment #1: Level of performance standard
There was convergence among stakeholders and provinces that natural gas combined cycle (NGCC) units operating in Canada cannot generally achieve an emission rate of 375 tonnes of CO2/GWh. The majority were supportive of a performance standard of 420 tonnes of CO2/GWh. However, some suggested as high as 500 or 550 tonnes/GWh while others suggested an approach where the performance standard level is phased in with the stringency increasing over time as technology matures. Alternatively, environmental non-governmental organizations (ENGOs) offered comments that ranged from upholding the 375 tonnes of CO2/GWh benchmark to tightening the performance standard.
Response #1: The Regulations raise the performance standard to 420 tonnes of CO2/GWh. This level more closely reflects the reasonably expected performance of a base-load natural gas combined cycle unit and responds directly to near-unanimous comments from industry, but is still within the range (360–420 tonnes of CO2/GWh) that was announced in June of 2010. It is also consistent with recent permits issued in the United States.
Comment #2: Definition of old or end of useful life unit
The proposed Regulations included a 45-year useful life period, as well as accommodation for units that are already party to a power purchase agreement or that began operation but switched to burn coal at a later date.
Some industry and provincial governments raised concerns regarding the proposed definition for the end of useful life and its effect on managing price impacts, and the risk of stranded investment and value. In particular, stakeholders felt that the useful life definition should be longer than the 45 years stated in the proposed Regulations. Many commented that it should be increased to 50 years, with some suggestions of it being longer yet, or of a phased-in approach to 50 years and determination on a unit case-by-case basis. The need to consider major capital investments and/or refurbishments as part of the useful life definition was also mentioned by some provincial and industry stakeholders, as well as additional flexibility for units that retire in or before 2020.
Alternatively, the general public and ENGOs requested that the definition of useful life be shortened, so that units would be phased out by 2025 or 2030, at the latest, in order to expedite the process of addressing climate change.
With respect to power purchase arrangements (PPAs), a couple of stakeholders expressed concern that, upon entering the PPA, they were expecting to be able to operate the unit in a competitive market for some years after the expiry of the PPA and generate additional profits. The proposed Regulations would limit or take away that ability. An industry stakeholder also raised concerns about the PPA approach published in CGI with respect to the circumstances of their specific unit.
Specific stakeholders also expressed concern about having a unit that started operation as an oil-fired unit, but then was re-commissioned to burn coal. They contend that the 45 years of useful life calculation should commence when the unit began burning coal instead of the date when the unit initially began operation.
Response #2: To further accommodate concerns regarding stranded value and to further moderate price impacts on consumers, the Government of Canada will establish a 50-year end of useful life definition that will be phased in over three stages. The three stages and accompanying end-of-life in each will be:
- 50 years or the end of 2019 for units built before 1975;
- 50 years or the end of 2029 for units built after 1974 but before 1986; and
- 50 years thereafter.
This change provides more time to some of the earliest units to be affected to moderate price impacts and reduce stranded value, while at the same time respecting Canada’s 2020 emission reduction target.
The Government appreciates the concern to rebase the start date of the unit to when a unit began to use coal as a fuel, but also recognizes that the unit began generating revenue and recovering its capital costs at the time it began operation, not just at the time it began burning coal. As a result, the Regulations will maintain the 18-month life extension for units that converted from oil to coal prior to June 23, 2010.
Comment #3: Carbon capture and storage (CCS) issues
The proposed Regulations included a temporary exemption from the performance standard until 2025 for new and old units that incorporate technology for CCS.
Some provinces and industry stakeholders expressed concerns that the requirements for the CCS temporary exemption were too aggressive, particularly for old units, given the current state of the technology. They advocated that more flexibility was needed in order to reduce the risk of non-compliance and encourage investment in the technology. Suggestions from stakeholders included allowing for project-specific schedules reflecting the learning required for technology development and differences in project deployment schedules, providing two additional years for old units to meet the construction milestones, and subjecting old units to the same requirements as new units.
Comments from NGOs on the CCS temporary exemption varied from eliminating the exemption, to requiring old units that plan to undertake CCS to capture at a higher rate than the 30% identified in the proposed Regulations. They expressed concerns that the CCS temporary exemption could be abused if units close after the end of the exemption period, and that the 30% capture rate for old units receiving the deferral is too permissive.
Some provinces and industry stakeholders raised concerns over the timing and stringency of the application requirements, including, for example, the challenges for a board of directors to unconditionally approve of the construction of the CCS system in advance of the completion of a front-end engineering and design study (FEED study) as well as other related regulatory approvals.
Other industry stakeholders requested additional flexibilities to the requirements, such as a larger margin of error for capital cost estimates in the FEED study or the use of offsets as a way to comply with the 30% capture requirement.
For existing units, some industry and provincial stakeholders claim that their CCS projects will not be economical under the proposed regulatory approach because they were relying on an offset trading market to render their projects economically viable. Furthermore, some units will begin operating before July 1, 2015, and consequently will be able to operate for a significant number of years before the performance standard applies to them at the end of their useful life, leaving no incentive to proceed with CCS.
Some provinces and industry stakeholders have advocated that the 18-month exemption as an incentive for installing CCS technology on existing units is insufficient to provide economic returns for financing CCS projects. They requested broader recognition for emission reductions achieved through the use of CCS as well as increased flexibility as to how this recognition should be implemented in order to allow emission levels to be met in a way that is flexible for energy system management and more fiscally prudent for utilities.
Stakeholder suggestions for broadening recognition included expanding the 18-month exemption to account for ongoing capture at higher rates at existing units and recognizing reductions through CCS that go beyond what is required. A variety of suggestions as to how this recognition should be implemented were provided, including credit or banking instruments that could be used across a company’s fleet or traded among utilities.
One NGO suggested eliminating the 18-month exemption.
Some provinces and industry stakeholders expressed concerns that the CCS flexibilities left units located in areas where the geology is less favourable to implementing CCS at an unfair disadvantage when it comes to compliance options and that the other flexibility provisions (i.e. substitution and standby), which had earlier expiry dates, were being held to an unfair deadline compared to the CCS provisions. Consequently, they argued that the proposed Regulations would favour the ongoing use of coal to generate electricity in some regions in Canada more than others. Suggestions were also noted that biomass should receive comparable treatment as offered by CCS deferrals.
There were also comments from provinces and industry requesting clarity on potential emissions from leakage piping, pumps and storage, and on how assurances related to the transportation and storage of CO2 and their compliance with applicable laws would be provided.
Response #3: The CCS provisions in the final Regulations have been refined to increase the incentives for CCS while at the same time ensuring emission reductions occur. This allows for more time for the deployment of CCS at old units and addresses the majority of concerns raised by provinces and industry.
Specifically, the milestone requirements for old units have been changed to match those for new units. This is because the phased-in useful life results in the majority of old units not requiring the CCS deferral until 2020, at which point the construction milestones for old units would coincide with those for new units. As a result, this change also removes the 30% capture requirement for old units as these units will need to capture at a rate to meet the performance standard within a maximum five years of the start of the deferral. The stringent and regulated construction milestones continue to ensure that units that receive a CCS temporary exemption are taking real steps to implement CCS and meet the performance standard.
For existing units, the Government proposes to provide greater recognition of and incentive for efforts to capture early by increasing the 18-month exemption available for transfer to an old unit to two years.
Flexibility in other provisions has been increased (see other sections), which should ease concerns regarding equity among provisions.
Comment #4: Substitution of units
Industry comments on the substitution provision were generally supportive and included an interest to broaden its application. In particular, it was suggested that the 2020 deadline for this provision be removed so that it remains available, intercompany substitutions be allowed so long as the same level of real reductions are achieved, and that a temporary substitution of an old unit or a standby unit be allowed for when existing units temporarily shut down for a period of time. One stakeholder also suggested that units at a common site (i.e. in the same facility) be permitted to transfer their useful life between them so that they would have a common retirement date. There was also a suggestion from industry to broaden the substitution provision to provide recognition for the early shutdown of units ahead of their end of useful life.
Other stakeholders stated that the substitution provision should be removed entirely because old units should not be allowed to operate past their end of life, and that the provision presented a loophole.
Response #4: This provision has the intention of providing additional flexibility for stakeholders while ensuring emission reductions are maintained. The Government of Canada has expanded the substitution provision in the final Regulations to provide recognition for early permanent shutdown of units before their end of useful life by allowing them to transfer their remaining years to another unit or units. The Government of Canada will also remove the 2020 deadline for the substitution provision.
Comment #5: Coverage of industrial sectors, petroleum coke (petcoke), synthetic gas (syngas) and biomass fuels
Industry stakeholders commented that the proposed Regulations, as drafted, could inadvertently cover industrial sectors that also generate electricity or include industrial activities that are considered beyond the scope of the electricity sector. In particular, concern was expressed that the inclusion of petcoke in the definition of coal could make some industrial sectors subject to these Regulations. Another expressed that these Regulations should not create a disincentive for industry to use fuels, such as through cogeneration processes — fuels that would otherwise be considered waste and flared. It was also commented that these Regulations should not cover “upstream” fuel manufacturing, processing or transportation, as would be the case for including emissions from gasification of coal for synfuel production.
One stakeholder supported the intention of these regulations to cover coal, coal derivatives (e.g. syngas) and petroleum coke, whereas another suggested that the Regulations should cover petroleum coke only if petroleum coke is blended with coal or as a stand-alone fuel. It was also argued that petcoke is a low cost fuel and so including it in the definition of coal as part of these final Regulations would result in the abandonment of its use and subsequent higher energy costs and burden to ratepayers.
Response #5: The Government of Canada agrees that the intention of these Regulations is to address emissions of CO2 specifically from the electricity sector and has taken steps to ensure that the Regulations will not apply to industrial sectors that do not generate electricity for retail sale.
With regard to petroleum coke, the combustion of this fuel source emits more GHG emissions and more sulphur dioxide emissions than coal. Allowing the unregulated use of such a fuel would work at counter-purposes to the Regulations. For this reason, the definition of coal continues to include petroleum coke.
Emissions from the production of synthetic gas (syngas) from coal gasification will continue to be covered so long as the gasification system and the coal-fired electricity unit have a responsible person in common. The Government of Canada feels that the pre-processing of coal for the purpose of electricity generation for sale is consistent with the general intent of these Regulations.
Synfuel is included in the definition of coal, and so units that combust synfuels for electricity generation for sale will be subject to these Regulations.
Gasification systems that produce synfuels that are not used for the generation of electricity for sale will not be covered by these Regulations.
Comment #6: Standby units and emergency circumstances
The few comments on these provisions were in agreement that the requirement to operate such units at a 7% capacity factor or lower was too restrictive and that the percentage should be raised. They commented that standby units require a higher capacity factor to maintain a stable generation level and to avoid costs to equipment and maintenance that arise from unit cold starts. Suggestions on what the percentage should be included 9%, 15% to 40–50%.
It was also commented that standby units are used infrequently and provide benefit to the system and so there should be no end date on this provision and that these units should be able to participate in the substitution provision and adopt CCS provisions at the end of the standby period.
There was general agreement that further clarification of the emergency circumstances provision was needed. In particular, it was requested that the provision explicitly include consideration of drought and provincial commitments to address electricity system emergencies in other jurisdictions as eligible circumstances. It was also suggested that more precision was needed to limit abuse of this provision, especially if effects of climate change results in greater emergency situations.
Further clarity on who should declare an emergency was identified where the majority of comments, including from industry, provincial entities and NGOs, stated that the final determination of an emergency should be made by each respective provincial government or provincial entity, as opposed to being left to the federal government or being applied for by the regulatees.
Response #6: The standby unit provisions of the proposed Regulations were included as a temporary transition measure and were not seen as a way to maintain coal-fired electricity capacity. The Government of Canada appreciates that standby units can improve the reliability of the electricity grid, particularly while the industry makes the necessary investments. As a result, the Government of Canada has increased the availability of this provision to 2030 relative to 2020, as previously published in CGI; however, after that year, these units will be subject to the performance standard.
Upon consideration of comments received on the allowable capacity factor for standby units, the Government of Canada has increased the capacity factor from 7% to 9% in the final Regulations. It was understood that the 7% limit would allow units to maintain equipment in a state to be able to ramp up the unit while at the same time not being an active contributor to the electricity system. The 9% value is reasonably consistent with this intention and ensures that these units are reserved purely for emergency circumstances. Higher capacity factor limits would change the nature of this provision and allow significant operation of the standby units outside of emergency circumstances.
The Government of Canada reviewed the emergency provision as proposed in CGI and concludes that it already provides sufficient flexibility for appropriate emergency circumstances to be considered eligible, as well as maintains stringency through its requirements, approval process and duration limitations. Emergencies must either arise due to an extraordinary, unforeseen and irresistible event, or be declared by the province as an emergency. The emergency circumstance must result in a disruption or significant risk of disruption of the electricity supply within that province, and the operation of the unit is necessary to mitigate this disruption.
Further clarity of this provision will be provided through guidance documents.
Comment #7
As mentioned earlier, thousands of comments were received from various stakeholder groups. The vast majority of these comments were strongly supportive of the Government of Canada’s intention to take action on climate change, if not to request more stringent action. There were also a number of stakeholders that challenged the validity of climate change and its supporting evidence, and in so doing opposed the need for these final Regulations.
Response #7: The Intergovernmental Panel on Climate Change’s fourth assessment report, Climate Change 2007, concludes that the climate system is clearly warming, and it is very likely that emissions of greenhouse gases (GHGs) from human activities worldwide, primarily from the combustion of fossil fuels, are responsible for most of the observed warming since the mid-20th century.
The Government of Canada inscribed in the Copenhagen Accord an ambitious target of reducing our national GHG emissions by 17% from 2005 levels by 2020 and continues to be committed to take action and achieve this target through a sector-by-sector approach. These Regulations to reduce GHG emissions from the coal-fired electricity sector are a critical component of this approach.
Comment #8: Choice of instrument
Some commenters felt the electricity performance standard was an inappropriate instrument to address greenhouse gas emissions, distributing costs unevenly across the nation and placing the burden on consumers rather than industry.
Response #8: The Government of Canada is moving forward on a climate change plan that involves regulating domestic greenhouse gas emissions on a sector-by-sector basis.
The U.S. EPA is currently developing regulations for specific sources of emissions. Given the integration of our two economies, a similar sector-by-sector regulatory plan will allow Canada to make concrete progress towards meeting our emission reduction objectives.
The sector-by-sector approach considers the circumstances of each sector, and tailors the approach to attain significant greenhouse gas emission reductions while minimizing competitiveness impacts. It will result in real emission reductions, while spurring innovation and maintaining competitiveness.
As detailed above in the regulatory and non-regulatory options considered section of this statement, this regulatory approach is determined to be the most effective instrument to address GHG emissions in the Canadian electricity generation sector.
Comment #9
A number of industry stakeholders requested other flexibilities to allow the electricity industry to develop, refine, and prove the effectiveness of emissions reduction technology such as CCS, as well as provide time to better understand potential impacts of the Regulations. Suggestions included extending the coming into force date, and having the Regulations come into effect in a more gradual fashion through a gradual tightening of the performance standard. A number of comments, including those from industry and provinces, advocated for a “fleet” approach, whereby companies would have greater flexibility in managing their own assets, while maintaining the same GHG reduction policy intent at lower costs. The details or suggestions of how to implement a “fleet” approach varied widely. For example, there were requests for such a regulatory approach to include all large emitters in the economy, or apply only to new and end-of-life units, but not existing ones, or simply receiving recognition for early shut down of units.
Alternatively, one industry stakeholder stated that there is a need for regulatory certainty to guide future investments and advocated that the publication of these Regulations should not be delayed. In addition, the vast majority of the total comments received through the 60-day consultation period were from the general public and they, along with some ENGOs, noted the importance of applying the performance standard immediately or on more aggressive timelines in light of the need to reduce GHG emissions. In particular, comments identified the need to guard against any rush to build coal plants prior to the coming into force date of the performance standard.
Response #9: The Government of Canada will proceed with its intended coming into force date of July 1, 2015, for the performance standard requirements of these Regulations applied on a unit by unit basis. New units built after that date will need to meet the performance standard of 420 tonnes of CO2/GWh.
The July 1, 2015, coming into force date, was announced in June 2010 and was maintained in the CGI publication. It was selected to provide predictable and sufficient lead time for industry to respond to the new regulatory requirements of these Regulations and take advantage of anticipated capital stock turnover cycles in order to not strand existing capital, while at the same time moving forward with the Government of Canada’s commitment to reduce GHGs. Continuing with the July 1, 2015, date maintains a balance between comments that requested to either expedite or delay the coming into force date of these Regulations.
The federal government has made the decision to follow a sector-by-sector regulatory approach accomplished through, in the case of coal-fired electricity, an output-based performance standard.
With that said, elements in these Regulations, as well as refinements made based on comments received, go a long way towards incorporating provisions that allow corporations to better manage their coal-fired assets. Specifically,
- the substitution (swapping) provision allows for recognition of early compliance with the performance standard;
- the new provision providing recognition for early shut of a unit allows for transfer of years of operation between units of a similar size; and
- the recognition for installing CCS early (i.e. in advance of being subject to the performance standard) in the form of a deferral that can be transferred to another unit has been increased from 18 months to 2 years.
Comment #10
A number of industry stakeholders commented that the quantification sections of the proposed Regulations should be removed and referenced as a separate guidance document. Their argument is that future amendments would be more easily made in a guidance document than as amendments to regulations. For example, a couple of industry stakeholders noted that the requirements are overly prescriptive and amendments may be needed to respond to advancements in monitoring and measurement practices or technology.
Response #10: The quantification methods are integral to the implementation of the policies within these Regulations and should not be developed separately. It should be recognized that publication of the quantification methods in these Regulations does not prevent the ability to consider advancements in practices or technology. Revisions to the quantification methods, if deemed necessary, can still be made through subsequent amendments to these Regulations. While it is appreciated that revisions to the actual guidance document can be made more easily outside of the regulatory process, these Regulations would likely still need an amendment in order to recognize the revised document version. In addition, making changes to how these Regulations function through the implementation of a formal regulatory process ensures that stakeholders are informed and have an opportunity to participate in that conversation. Therefore, the Government of Canada determined that these sections should continue to be located as a direct part of the regulatory text.
Comment #11
The exclusion of CO2 emissions from biomass from the performance standard was identified as an issue of concern during the comment period. Alternatively, it was stated that the use of municipal solid waste should be recognized because this material would no longer be present in landfills to produce methane gas.
Response #11: The greenhouse gases accounting methodology for the national report inventory is based on the Intergovernmental Panel on Climate Change (IPCC) 2006 guidelines. Within these guidelines, CO2 emissions from biomass combustion are not accounted for because they are assumed to be reabsorbed by vegetation during the next growing season. The proposed and final Regulations are consistent with the IPCC treatment of biomass combustion and provide significant recognition for biomass use.
Municipal solid waste will be recognized as a biomass fuel so long as it meets the definition of biomass as inscribed in these Regulations.
Comment #12
Industry stakeholders requested that criminal penalties as defined under CEPA 1999 be removed for their respective company’s directors and corporate officers in the case of non-compliance. Their rationale was that criminal penalties discourage significant investment decisions on emission reduction activity, such as the decision to implement CCS where there is a small risk that it may not be operational in the required time period. Industry stakeholders are also concerned because electricity generators can be forced by provincial system operators to run in order to maintain system reliability, resulting in non-compliance.
Response #12: These Regulations are being implemented through CEPA 1999 and so are subject to the penalty provisions therein. For this reason the penalties in CEPA 1999 will apply as set forth in the Act.
In addition, the Government of Canada, through consultation with stakeholders and provinces, has considered specific comments and refined the regulatory provisions which should address some concerns and reduce the potential of non-compliance while maintaining the environmental objective of GHG emission reductions. These Regulations also contain provisions to recognize and accommodate emergency circumstances where units will need to operate outside of the performance standard for a limited time in order to address disruptions to system reliability.
Comment #13
Stakeholders and provinces also provided a number of comments related to improving the clarity of regulatory provisions and intent and function as well as administrative edits.
Response #13: These comments did not impact the general policy intent like those identified in the above discussion and were duly considered in the preparation of the Regulations.
Comment #14: Comments on related policy areas
Some comments were received and touched on areas that, while related to the proposed Regulations, were not specific to the proposal.
Stakeholders reiterated early comments that it would be desirable for the federal government to provide clarity as soon as possible regarding the regulatory requirements for new natural gas-fired units.
Industry stakeholders were concerned about the precedent the performance standard for coal-fired generation would set for possible future regulations on GHG emissions from natural gas-fired electricity generation. In addition, some expressed concern that a single performance standard may not be applicable to all types of natural gas facilities.
Industry stakeholders commented that there was a need for a coordinated approach as the government implements its sector-by-sector plan, in order to ensure fairness and equity. In addition, GHG regulations should be aligned with any requirements to address air pollutants from this sector.
Response #14: The Government of Canada’s current focus is to develop the performance standard for coal-fired units. These comments, however, have been and will be taken into account as the Government of Canada moves forward with the sector-by-sector approach.
All regulations for the electricity sector, whether for GHG or air pollutants, will continue to be developed in a coordinated and aligned fashion.
Comment #15: Equivalency agreements
Some provinces and industries have expressed their desire for equivalency agreements pursuant to which the federal regulation would not apply in a particular province. Their rationale is that some provincial regulations provide equivalent or greater GHG reductions, potentially at lesser cost than the federal regulations, and that the agreement would help avoid regulatory duplication.
Non-governmental organizations also expressed support for the use of equivalency agreements but stressed the importance for equivalent or greater GHG reductions from provincial regulations. In addition, the federal regulations are to remain as a backstop, and would start applying in the event of termination of the agreement.
Response #15: Equivalency agreements with a province may be established under CEPA 1999 if there is an enforceable provincial regime that generates equivalent or better environmental outcome, and if the provincial legislation includes provisions similar to section 17 to 20 of CEPA 1999 for the investigation of alleged offences. Equivalency agreements have duration of not more than five years, but may be renewed.
Discussions have been held with some provinces regarding equivalency agreements. In particular, the Government of Canada and the provinces of Nova Scotia and Saskatchewan have announced that they are developing equivalency agreements. The objective is to avoid duplication of effort in controlling GHG emissions, ensure that industry does not face two sets of regulations and allow the province to reduce its emissions in a manner that is appropriate to its particular circumstances.
The Government of Canada will consider entering into agreements with other provinces and territories that desire to do so when the requisite conditions under CEPA 1999 are met.
10.2 Economics-related comments
Extensive consultations with provincial, territorial and industry officials have resulted in significant adjustments to the parameters underlying the estimated business and consumer impacts of the Regulations since the publication of the proposed Regulations in CGI. The following comments summarize the comments received and how they were addressed in the analysis of the Regulations.
Comment #16
Following publication in CGI concerns were expressed by some stakeholders on the impact of the Regulations on the price of electricity on consumers in Alberta, and the level of analysis on the cost and availability of natural gas assumed for Nova Scotia.
Response #16: The approach to modelling the Alberta electricity pool pricing dynamics in E3MC has been updated for the CGII analysis based on input from stakeholders. The new methodology resulted in higher price impacts in Alberta than would have been estimated using the methodology for the CGI analysis, with price impacts occurring gradually over time as natural gas plants set the pool price of electricity more often following coal-fired plant retirements. A study by Power Advisory LLC was commissioned which forecasted price impacts which are in the range of those presented in the CGII analysis, although they are somewhat lower. (see footnote 74) This study also helped ensure the new approach for CGII accurately reflected the dynamics of the competitive electricity market in Alberta.
The forecasted cost of natural gas for Nova Scotia was also updated for the CGII analysis. Upon additional analysis based on input from stakeholders, the prices for natural gas delivered to utilities have been increased relative to the forecasted prices underlying the CGI analysis. A study by Ziff Energy Group was commissioned for Environment Canada in order to assess the cost and availability of natural gas in Nova Scotia. (see footnote 75) The assessment concluded that Nova Scotia is expected to have no difficulty meeting natural gas requirements at fair market prices throughout the forecast period, and that the electricity performance standard is expected to have a minimal impact on natural gas prices in Nova Scotia. The assessment noted that due to falling natural gas production in the Maritimes a reversal of the Maritimes and Northeast (M&NE) Pipeline from a net exporter to a net importer of natural gas is expected by 2019, regardless of the Regulations.
Comment #17: HR Milner and the HR Milner 2 expansion
Some commenters expressed interest about why the HR Milner plant was included in the BAU and if the cost-benefit analysis, emissions results, and price impacts of the proposed Regulations were highly sensitive to its inclusion and the HR Milner 2 expansion.
Response #17: The HR Milner plant’s inclusion in the BAU reflects discussion between Environment Canada and Alberta Government officials. Based on these discussions, evidence was provided to support an in-service date for HR Milner occurring between late 2015 and 2018.
The inclusion of the HR Milner plant in the BAU impacts emission reductions under the proposed Regulations. However, if this plant does not generate electricity, natural gas-fired generating units will be built. Therefore, the reductions in the policy scenario will be the difference between HR Milner’s emissions and the emissions coming from natural gas units that are built instead.
Alberta’s electricity market is highly responsive to supply and demand conditions. Therefore, the inclusion or exclusion of the HR Milner expansion may not necessarily have a significant impact on the pool price. Given the assumptions underlying Environment Canada’s analysis of the proposed Regulations for coal-fired generation, the inclusion of the HR Milner expansion is expected to have a minimal impact on consumer prices. If the HR Milner expansion does not proceed, and natural gas-fired generation is brought on-line to service electricity demand, consumer prices will be somewhat higher (in the range of 1.5 to 2 cents per kWh).
Comment #18: Natural gas price forecast
Many commenters raised concerns that the natural gas price forecast used in the cost-benefit analysis was biased downwards, requesting a more thorough sensitivity analysis under a wider range of natural gas prices.
Response #18: The natural gas price forecast used in the analysis of the proposed Regulations was based on the most up-to-date economic data available at the time. Subsequently, the natural gas price forecast has been updated to better reflect current economic conditions. The analysis of the final Regulations uses the natural gas price forecast produced by E3MC, which is based on historical natural gas costs for utilities by province from Statistics Canada, and the projected growth rate of natural gas prices from the National Energy Board. These prices are somewhat higher than the CGI prices (see section 7.2.2). To further expand the natural gas sensitivity analysis, a univariate sensitivity analysis was completed on the cost-benefit analysis of the Regulations. To get a sense of the sensitivity of consumer price impacts to future natural gas prices, these impacts were calculated under a series of alternative assumptions about the future price of natural gas at Henry Hub (section 7.6.1).
Comment #19: Natural gas price response
A commenter commissioned a study by Ziff Energy Group that suggested the standard, as presented in the proposed Regulations, if applied throughout North America, would create substantial upward pressure on natural gas prices.
Response #19: The analysis of the proposed and final Regulations is limited to the incremental impact of the Canadian standard, which, according to a study commissioned by Ziff Energy Group for Environment Canada, would have a negligible impact on North American natural gas prices. The impact of the policy choices of other nations is outside of the scope of the analysis.
Comment #20: Emissions from imported electricity
Numerous commenters stated that the proposed Regulations would simply displace greenhouse gas emissions to other jurisdictions rather than create real reductions, and that this “carbon leakage” is a persistent policy issue inherent to all non-global regulations. Further, the use of a global value for the SCC is inconsistent with an approach which fails to estimate and value emissions created through carbon leakage.
Response #20: In December 2009, the Government of Canada committed to a national greenhouse gas reduction target of 17% below its 2005 levels by 2020, and inscribed this in the Copenhagen Accord. Our 2020 target is aligned with that of the United States.
The U.S. EPA is currently developing regulations for specific sources of emissions. Given the integration of the two economies, a similar sector-by-sector regulatory plan will allow both countries to make concrete progress towards meeting emission reduction objectives. To the extent that both the United States and Canada are moving toward the same objective in tandem, the potential for carbon leakage to occur should be mitigated. Further, even taking into account the small increase in imports of electricity from the United States, overall emissions reductions in Canada remain significant over the study period.
More specifically, the Regulations will phase out high-emitting coal-fired generation and promote a transition towards lower- or non-emitting types of generation such as high-efficiency natural gas, renewable energy, or fossil fuel-fired power with carbon capture and storage. A list of responses to meet the capacity and generation gaps over the 21-year period includes an increase in capacity utilization, construction of new natural gas or coal CCS units, reduced exports, and increased imports. Overall, the Regulations are expected to result in a net reduction of 214 Mt over the period 2015–2035.
Social cost of carbon values are used for the analysis of Canadian regulations to assess the avoided global damages associated with GHG emission reductions brought forth by Canadian actions in order to ensure that the full value of our contribution to the reduction of global damages from climate change is recognized. It would also be challenging to separate out the specific benefit to Canada of an emission reduction in Canada given that climate change is a global environmental issue. The values used for this analysis are based on the approach used by the EPA developed by an interagency working group and world leading experts on the issue.
Comment #21: Perceived issues around the quantification and monetization of health benefits
A commenter stated that the health benefits presented in the analysis of the proposed Regulations were unrealistic and inaccurately monetized benefits associated with other provincial and federal regulations as benefits of the proposed Regulations.
Response #21: All known/existing provincial and federal air regulations have been incorporated into the BAU scenario of the cost-benefit analysis. Therefore, all the CAC reductions and associated health and environmental benefits presented are incremental and attributable to the Regulations. As presented in section 7.2.4, a comprehensive modelling work was conducted using AURAMS, AQVM2, and AQBAT of Health Canada to assess the impacts of CAC reductions on the levels of ambient air concentration and subsequently on health and environment.
Comment #22: Effects of the proposed Regulations on coal-related industries
Multiple commenters voiced concerns with the lack of analysis provided on coal-associated industries such as coal mining. The proposed and final Regulations are expected to decrease the demand for coal in these markets. These commenters contended that this would cause the coal mining industry to shrink, increasing unemployment and causing economic damages that were not monetized in the cost-benefit analysis of the proposed Regulations.
Response #22: The calculation of the NPV in the cost-benefit analysis for the Regulations factors in the impacts of replacing coal-fired generation with natural gas fired generation in terms of costs and avoided costs for electricity generation. Section 8.1 now incorporates a more detailed analysis of the impacts on the coal sector. The conclusion of the analysis was that some transitional unemployment would occur due to the Regulations, but that transitional costs are expected to be minimal/moderate.
Comment #23: Carbon capture and sequestration analysis
Commenters noted that the cost-benefit analysis of the proposed Regulations did not specifically address the costs or benefits of carbon capture and sequestration, how these specific technologies may impact emissions, generation costs, and any resulting secondary economic activities.
Response #23: The cost-benefit analysis for the Regulations now includes impacts from the application of CCS technology to Boundary Dam units 4, 5 and 6. The estimated capital costs of CCS have been incorporated for these units, while CO2 emissions reductions have been valued at the SCC. The analysis also takes into account the downstream impact of the use of CO2 for EOR. In the distributional section it was noted that employment impacts in Saskatchewan’s coal mining sector would be mitigated by keeping coal-fired generation capacity running with the successful application of CCS. Although considered a transfer in cost-benefit analysis, the Government of Saskatchewan would likely collect tax and royalty revenues on the incremental production of oil in this province, which constitutes a portion of the net benefit from CCS/EOR to Canada as a whole.
Comment #24: Inappropriate import prices
A large group of commenters stated that import and export prices as presented in the CGI analysis were neither in line with current nor historical data. They asserted that the import/export prices used in the cost-benefit analysis of the proposed Regulations were significantly underestimated, biasing the cost of the estimated reduction in exports and increase in imports downwards.
Response #24: The price forecasts for imports and exports are calculated within E3MC based on the historical mix and outlook of future mix of short- and long-term electricity export contracts. The price of short- term and long-term electricity contracts vary systematically, thus assumptions on the future contract mix will influence forecasted prices. Imports from the United States are based on the weighted average cost of power from the importing area.
Comment #25: Lifecycle approach to emissions
A commenter noted that a full life cycle approach to emissions analysis would present a complete emissions profile of various fuels. When plant source emissions are considered, analysis is biased towards natural gas; however, the extractions of some types of natural gas produce large environmental impacts. It could be that unconventional natural gas lifetime emissions are greater than the lifetime emissions of traditional coal.
Response #25: The E3MC model is an integrated model that projects emissions for all of the sectors of the economy. While the cost-benefit analysis focuses on the direct impacts of the policy on the electricity sector and consumers, the macroeconomic modelling takes into account the secondary impacts on the economy, also factoring in changes in emissions from other sectors, such as the oil and gas sector. Factoring in all of these impacts, the policy leads to a net reduction in GHG emissions for Canada.
Comment #26: Unit level data
Commenters felt the average capital, and fixed and variable O&M costs reported in the CGI analysis were rather low when compared to AEO estimates.
Response #26: Environment Canada’s modelling framework is parameterized with the most up-to-date publicly available electricity cost and performance characteristics for new generating technologies. In developing these costs and performance characteristics, Environment Canada sought the advice of provinces and territories, electricity generators and the Canadian Electricity Association. The information sought included capital costs, fixed and variable O&M, heat rates and emission intensity for each unit included in Environment Canada’s modelling framework.
Where information was provided by the officials from the provinces/territories, electricity generators and the Canadian Electricity Association, they were included in the model. In the absence of province or generator specific information, the modelling relied on data from the EIA.
For the Annual Energy Outlook 2011 cycle, EIA commissioned an external consultant to develop current cost estimates for utility-scale electric generating plants. This report can be found at www.eia.gov/oiaf/beck_plantcosts/index.html. Site-specific costs for geothermal were provided by the National Energy Renewable Laboratory, “Updated U.S. Geothermal Supply Curve,” February 2010.
Comment #27: BAU and Policy scenario representation
Numerous commenters had concerns with the characterization of the BAU and Policy case as developed within the analysis of the proposed Regulations.
Response #27: The BAU scenario underlying the analysis of the final electricity performance standard for coal-fired generation has been revised to better reflect Alberta’s load growth, and the permanent closure of Sundance units 1 and 2. The import capabilities have also been reviewed.
Environment Canada has been working with provincial and industry stakeholders to incorporate their comments where feasible. Saskatchewan’s load growth has been reviewed along with the infrastructure costs provided by the stakeholders. The refurbishment of Boundary Dam 3 with CCS was included in the BAU because the intent to move forward with this project was established well before the announcement of the policy in CGI. Further CCS refurbishments of coal units in Saskatchewan have also been taken into consideration as per the advice of Saskatchewan officials.
Comment #28: Excess capacity
One of the main comments received on the modelling undertaken in support of the proposed Regulations pertained to the increased utilization of excess capacity. Commenters were critical of the assumption that there was excess capacity to utilize.
Response #28: Environment Canada’s modelling framework is parameterized with Statistics Canada data — publicly available and confidential — and with publicly available company data. For capacity, it is based on Statistics Canada name-plant capacity by unit. Using Statistics Canada’s confidential micro-data, operational characteristics are determined at the unit level (e.g. outage rate). This outage rate is then applied to the name-plant capacity to determine the effective capacity.
Comment #29: Plant builds
Many commenters believed that the plant build schedule included in the modelling for the CGI analysis was unrealistic and inconsistent with current utility expansion plans.
Response #29: Environment Canada aligned new additions with current provincial and utility expansion plans. In a situation where there is a supply-demand imbalance, Environment Canada’s E3MC model endogenously builds new capacity. These endogenous builds follow industry establish rules for bringing on new capacity (e.g. four years for a combined cycle gas turbine, one to two years for wind units).
Comment #30: Trade flow infrastructure
Commenters felt that the trade flows reported in the CGI analysis exceeded the capacity of current transmission lines and that the costs of additional infrastructure were underestimated.
Response #30: Environment Canada’s modelling assumed that no infrastructure would be built to allow a significant increase in electricity trade. The exports/imports reported in CGI are the cumulative total for the period 2015 to 2030. While Environment Canada’s model has the capacity to build interprovincial and international flows, due diligence is undertaken to ensure that provincial plans are fully respected (i.e. the model only builds new transmission that is provided in provincial plans). If new infrastructure is built, then the model will fully cost the building of the new transmission capacity.
Overall
Provisions developed within the Regulations respond to concerns raised through the consultations, but are limited in availability and duration in order to emphasize their use as transitional measures, all the while maintaining environmental objectives and the stringency of the proposed Regulations.
These provisions
- maintain consistency of a national regulatory approach and the focus on emission reductions;
- treat regions and regulatees equitably;
- minimize stranded capital investments; and
- avoid setting an undesirable precedent for other sectors.
11. Regulatory cooperation
These Regulations have been developed with consideration of approaches undertaken by other jurisdictions, mainly Canadian provinces and the United States.
Federal and state-level actions in the United States are setting limits for new fossil fuel-fired electric utility generating units based on a performance standard approach based on parity with natural gas combined-cycle generation. On March 27, 2012, the United States EPA issued proposed New Source Performance Standards (NSPS) for new fossil fuel-fired electric utility generating units (EGUs) including: fossil fuel-fired boilers, integrated gasification combined cycle (IGCC) units and stationary combined cycle turbine units. The rule would act as a base level requirement, whereby any new power plant could emit no more than 454 tonnes of CO2/GWh on a gross output basis. Permits for individual plants could be more stringent. For example, in November 2011, the EPA issued a pre-construction permit under the New Source Review Program for a 590 MW Texas-based natural gas combined cycle electricity generating facility with an annual emission limit of 416 t/GWh. In January 2012, the State of New York proposed to adopt CO2 Performance Standards for Major Electric Generating Facilities, under which boilers, natural gas combined cycle units and gas-fired stationary engines would be subject to a performance standard of 420 t/GWh. These levels support Canada’s choice of 420 t/GWh as the proposed performance standard based on natural gas combined-cycle technology for coal-fired electricity generation.
While U.S. GHG requirements do not address existing coal plants, the EPA has finalized stringent air pollutant requirements for these plants, most notably the Cross-State Air Pollution Rule (CSAPR) and the Mercury and Air Toxics Standards (MATS). Within Canada, the federal government has consulted extensively with provincial governments throughout the development of these Regulations. In particular, the Government of Canada and the province of Nova Scotia have announced that they are developing an equivalency agreement. An equivalency agreement would see the federal regulations stand down and allow the provincial regulation to apply; an agreement is possible where there is an enforceable provincial regime that achieves an equivalent or better environmental outcome than the federal regulation.
An equivalency agreement is appropriate in this case because the estimated outcome on GHG emissions is equivalent, and the agreement allows the province of Nova Scotia to meet the goal in a manner that is appropriate to its particular circumstances. Both governments wish to avoid duplication of effort to control greenhouse gas emissions, and are working together to ensure that industry does not face two sets of regulations.
The Government of Canada will consider entering into agreements with other provinces and territories that desire to do so, provided that the requisite conditions under CEPA 1999 are met. Discussions have also taken place with Saskatchewan.
12. Rationale
The Government of Canada is committed to reducing Canada’s total GHG emissions to 17% below its 2005 levels by 2020 — a target that is inscribed in the Copenhagen Accord and aligned with the United States. In 2010, GHG emissions from the electricity generation sector contributed around 15% (or approximately 101 Mt) to Canada’s inventory of emissions. Coal-based electricity in Canada was responsible for 77 Mt of GHG emissions in Canada representing 77% of total electricity sector emissions.
The Government of Canada’s approach to addressing climate change is based on the principle of maximizing environmental performance improvements while minimizing adverse economic impacts. The regulated performance standard approach provides necessary regulatory certainty for the electricity sector at a time when the sector is facing major capital stock turnover, is administratively simpler than a cap-and-trade system, ensures the phase-in of lower- or non-emitting types of generation and provides more certain economic signals to decision makers considering new or replacement power generation plants. In addition, through consultations, industry and provincial stakeholders, in spite of having specific concerns, have expressed broad support of the regulated performance standard approach.
As a consequence, a cost-benefit analysis was conducted for the selected regulatory instrument, which indicated that it would result in a net reduction of approximately 214 Mt of CO2e of GHG emissions over a period of 21 years. The incremental benefit of achieving these reductions is estimated to be $23.3 billion while the incremental cost is estimated to be $16.1 billion over the same period. This results in a net present value of approximately $7.3 billion.
The Regulations are considered to be an effective and efficient way of fulfilling the Government of Canada’s commitment of reducing Canada’s total GHG emissions.
13. Implementation and enforcement
13.1 Implementation
The regulated community is small and well known and has already been extensively consulted in the development of the Regulations, as well as in previous efforts to regulate GHGs from this sector. As a result, there is a heightened awareness and interest in the forthcoming Regulations on the part of the regulatees.
To meet the objectives of the Regulations, compliance promotion activities targeting owners and operators of coal-fired electricity generators will be delivered to ensure a high level of compliance as early as possible during the regulatory implementation process.
In addition, the earliest regulatees will be required to register under the Regulations will be in 2013, where the requirement to comply with the performance standard will come into effect January 1, 2015. Compliance promotion activities will also be conducted before the coming into effect of these two requirements and as units become subject to the regulatory requirements based on their respective end of useful life date.
Regulatees will be required to submit a performance report with specified required information through an electronic reporting system. Environment Canada will monitor the GHG emission performance of electricity generating units and compliance with the Regulations.
It should also be considered that the number of regulatees needing to comply with the performance standard and reporting requirements increases over time as these requirements are relative to the electricity generating unit’s age. This phasing in of regulatees also facilitates easier implementation of compliance promotion activities and monitoring of compliance.
In the situation where a unit is found to exceed applicable standards, the normal course of events would be to perform an engineering audit as part of an enforcement inspection to determine if an enforcement action should be taken against the owner/ operators of the unit.
13.2 Enforcement
The Regulations are made under CEPA 1999; therefore, enforcement officers will, when verifying compliance with the Regulations, apply the Compliance and Enforcement Policy (see footnote 76) for CEPA 1999. This Policy sets out the range of possible responses to alleged violations, including warnings, directions, environmental protection compliance orders, ticketing, ministerial orders, injunctions, prosecution and environmental protection alternative measures (which are an alternative to a court prosecution after the laying of charges for a CEPA 1999 violation). In addition, the Policy explains when Environment Canada will resort to civil suits by the Crown for cost recovery.
To verify compliance, enforcement officers may carry out an inspection. An inspection may identify an alleged violation, and alleged violations may also be identified by Environment Canada’s technical personnel, through information transmitted to the Department by the Canada Border Services Agency or through complaints received from the public. Whenever a possible violation of the Regulations is identified, enforcement officers may carry out investigations.
When, following an inspection or an investigation, an enforcement officer discovers an alleged violation, the officer will choose the appropriate enforcement action based on the following factors:
- Nature of the alleged violation: This includes consideration of the damage, the intent of the alleged violator, whether it is a repeat violation, and whether an attempt has been made to conceal information or otherwise subvert the objectives and requirements of the Act;
- Effectiveness in achieving the desired result with the alleged violator: The desired result is compliance within the shortest possible time and with no further repetition of the violation. Factors to be considered include the violator’s history of compliance with the Act, willingness to cooperate with enforcement officers, and evidence of corrective action already taken; and
- Consistency: Enforcement officers will consider how similar situations have been handled in determining the measures to be taken to enforce the Act.
13.3 Penalties
Subject to the coming into force of section 72 of the Environmental Enforcement Act, chapter 14, under CEPA 1999, every person who commits an offence is liable, (a) on conviction on indictment, to a fine of not more than $1,000,000 or to imprisonment for a term of not more than three years, or to both; and (b) on summary conviction, to a fine of not more than $300,000 or to imprisonment for a term of not more than six months, or to both.
Where an offence under CEPA 1999 is committed or continued on more than one day, the person who committed the offence is liable to be convicted for a separate offence for each day on which it is committed or continued.
14. Performance measurement and evaluation
The Performance Measurement and Evaluation Plan (PMEP) describes the desired outcomes of the Regulations and establishes indicators to assess the performance of the Regulations in achieving these outcomes. The PMEP package comprises three documents:
- the Performance Measurement and Evaluation Plan, which details the regulatory evaluation process;
- the logic model, which provides a simplified visual walkthrough of the regulatory evaluation process; and
- the table of indicators, which lists clear performance indicators and associated targets, where applicable, in order to track the progress of each outcome of the Regulations.
The three documents complement each other and allow the reader to gain a clear understanding of the outcomes of the Regulations, the performance indicators, as well as the evaluation process.
Outcomes
The PMEP details the suite of outcomes for each unit as they comply with the Regulations. These outcomes include the following:
- Upon publication of the Regulations, the regulated community will become aware of the Regulations and meet the reporting requirements, when applicable (immediate outcome).
- Then, as the performance standard enters into force for a unit of a given vintage, the owner/operator of this unit will meet the performance standard, make use of time-limited flexibility mechanisms, invest in CCS technology, or retire the unit (intermediate outcome).
- In all cases, these cumulative actions will progressively contribute to the final outcomes and intended objective of the Regulations: reducing GHG emissions from coal-fired generation, and decreasing the proportion of electricity generated by high-emitting coal-fired sources (final outcome).
As a key feature of the Regulations, units will become subject to the performance standard requirements as well as to compliance and promotion activities gradually, depending on when they reach their respective end of useful life date. As a result, the outcomes, such as anticipated reductions in GHG emissions, will take place progressively and accumulate over time.
Performance indicators and evaluation
Clear, quantitative indicators and targets, where applicable, were defined for each outcome — immediate, intermediate and final — and will be tracked on a yearly basis. In addition, a compilation assessment will be conducted every five years starting in 2020 to gauge the performance of every indicator against the identified targets. This regular review process will allow the Department to clearly detail the impact of the Regulations on the coal-fired electricity generation sector as more and more units become subject to the regulatory requirements, and to evaluate the performance of the Regulations in reaching the intended targets. The five-year compilation review also respects the expected capital stock turnover timelines for this industry.
These performance indicators are available in the table of indicators, and make direct references to the outcomes listed in the logic model.
15. Contacts
Caroline Blais
Director
Electricity and Combustion Division
Environment Canada
351 Saint-Joseph Boulevard
Gatineau, Quebec
K1A 0H3
Telephone: 819-994-6272
Fax: 819-994-9938
Email: ecd-dec@ec.gc.ca
Brenda Tang
Acting Director
Regulatory Analysis and Valuation Division
Environment Canada
10 Wellington Street
Gatineau, Quebec
K1A 0H3
Telephone: 819-997-5755
Fax: 819-953-3241
Email: RAVD.DARV@ec.gc.ca
Footnote a
S.C. 2004, c. 15, s. 31
Footnote b
S.C. 1999, c. 33
Footnote c
S.C. 2002, c. 7, s. 124
Footnote d
S.C. 2008, c. 31, s. 5
Footnote e
S.C. 1999, c. 33
Footnote 1
The default higher heating values for wood and wood waste, agricultural byproducts and peat are on a totally dry basis. The default higher heating values for the other types of fuel are on a wet basis.
Footnote 2
The default higher heating values for wood and wood waste, agricultural byproducts and peat are on a totally dry basis. The default higher heating values for the other types of fuel are on a wet basis.
Footnote 3
The default higher heating values for wood and wood waste, agricultural byproducts and peat are on a totally dry basis. The default higher heating values for the other types of fuel are on a wet basis.
Footnote 4
The default higher heating values for wood and wood waste, agricultural byproducts and peat are on a totally dry basis. The default higher heating values for the other types of fuel are on a wet basis.
Footnote 5
The default higher heating value for pipeline quality natural gas is expressed in GJ/standard m3
Footnote 6
The default higher heating value and the default CO2 emission factor for propane are only for pure gas propane. The product commercially sold as propane is to be considered LPG for the purpose of these Regulations.
Footnote 7
The default higher heating value for pipeline quality natural gas is expressed in GJ/standard m3
Footnote 8
http://ec.gc.ca/ges-ghg/default.asp?lang=En&n=AC8F85A5 (Table S-2: Canada’s GHG Emissions 1990-2010, by IPCCSector). Table references electricity and heat sector.
Footnote 9
Numbers may not add up due to rounding.
Footnote 10
Source: National Inventory Report — Greenhouse Gas Sources and Sinks in Canada, Part 3, 1990-2009 (2011), Environment Canada.
Footnote 11
Source: Actual generation from Electric Power Generation, Transmission and Distribution (2008), Report on Energy Supply and Demand in Canada (2008). Potential generation from Electric Power Generating Stations (2008), Statistics Canada. Potential generation (GWh)_2008 = Capacity (GW)_2008 * 365 days * 24 hours per day.
Footnote 12
Ontario’s coal-fired generation is set to retire by 2015 due to provincial regulations.
Footnote 13
Source: Environment, Energy, and Economy Model of Canada — Environment Canada; other published sources. Please note that Keephills 3 comes online post-2010 and is not counted in the 2010 count.
Footnote 14
Keephills 3 comes online in 2011 so the total coal units in Canada used in these calculations is 55 rather than 54 which is presented in Table 2.
Footnote 15
Boundary Dam 3, 4, 5 and 6 are assumed to be rebuilt and thus are not retired.
Footnote 16
www.gov.sk.ca/news?newsId=ae413247-80ce-4c9a-b7e3-4cc39e89da94
Footnote 17
www.saskpower.com/sustainable_growth/projects/carbon_capture_storage.shtml
Footnote 18
Manufacturing industries, including mining and oil and gas extraction.
Footnote 19
TWh = terawatt-hours
Footnote 20
Data source: Energy Statistics Handbook, 1st Quarter, 2011, Statistics Canada, Catalogue No. 57-601-X.
Footnote 21
Lead reductions were not quantified and monetized.
Footnote 22
Operating and maintenance
Footnote 23
End-of-life of 45 years for coal-fired units was initially prescribed in the proposed Regulations.
Footnote 24
Federal policies include strengthened energy efficiency standards; the Renewable Fuels Regulations; ecoAction programs; and the Passenger Automobile and Light Truck Greenhouse Gas Emissions Regulations.
Footnote 25
Provincial policies include energy efficiency standards; building code regulations; incentives/rebates; Quebec fuel tax; the B.C. carbon tax; Alberta’s industrial regulations; Nova Scotia’s cap on electricity sector GHG emissions; Nova Scotia’s renewable energy standard; the Ontario coal phase-out; and the Ontario feed-in tariff.
Footnote 26
Sources: www.mei.gov.on.ca/en/pdf/MEI_LTEP_en.pdf, www.transalta.com/newsroom/news-releases/2011-02-08/transalta-issues-notice-termination-sundance-1-and-2-power-purchas, www.transalta.com/newsroom/news-releases/2010-04-01/transalta-fully-retires-all-units-its-wabamun-power-plant, www.cbc.ca/news/canada/new-brunswick/story/2010/03/10/nb-minto-grand-lake-closed-early-fire-437.html, www.saskpower.com/sustainable_growth/power_plan
Footnote 27
Coal-fired units do not operate in the retirement year.
Footnote 28
Keephills — 450 MW (2011), H. R. Milner — 450 MW (2018), Swan Hills (CCS) — 319 MW (2015), Endogenous Advanced Coal — 400 MW (2033, 2034, and 2035).
Footnote 29
Boundary Dam 3 (CCS) — 115 MW (2014).
Footnote 30
12 437 MW from Oil/Gas Combined Cycle, 2 830 MW from oil/gas combined turbine and 661 MW from oil/gas steam.
Footnote 31
These additions are based on industry-announced plants as well as endogenous builds from E3MC from 2010–2035.
Footnote 32
Based on estimates from recent coal units refurbished.
Footnote 33
EOR, An Opportunity for Alberta, Alberta Economic Development Agency, January 2009.
Footnote 34
United States Department of Energy, Improving Domestic Energy Security and Lowering CO2 Emissions with “Next Generation” CO2-Enhanced Oil Recovery (CO2-EOR), June 20, 2011, Table V-1. These figures were also considered relevant within the Canadian context by EC experts.
Footnote 35
United States Department of Energy, Improving Domestic Energy Security and Lowering CO2 Emissions with “Next Generation” CO2-Enhanced Oil Recovery (CO2-EOR), June 20, 2011.
Footnote 36
Based on estimates from recent coal units decommissioned.
Footnote 37
Canada’s Energy Future: Supply and Demand Projections to 2035, National Energy Board (November 2011).
Footnote 38
Impact of a Performance Standard for Coal Fired Generation, Ziff Energy Group (March 2011).
Footnote 39
AURAMS was developed and is continually updated by Environment Canada scientists of the Science and Technology Branch. AURAMS is currently used by Environment Canada for various applications related to air pollution in North America. The model is intended to describe the formation of tropospheric ozone, particulate matter, and acid deposition in North America in support of policy and decision making.
Footnote 40
See Gong et al., 2006; McKeen et al., 2007; Samaali et al., 2009; Smyth et al., 2009.
Footnote 41
The relationship between air pollution emissions and ambient air quality is extremely complicated and non-linear. This is particularly true for the formation of ground level ozone, through the interaction of NOx and VOCs.
Footnote 42
The AQBAT model contains functions representing the relationship between air pollution exposure, and per capita health risks. The model also contains estimates of the social welfare benefit (or socio-economic value) of reducing the risks of different health outcomes. Using the estimated changes in ambient air quality under the Regulations, AQBAT estimated how the per capita risk of health problems would be reduced. Changes in per capita health risks are then multiplied by the appropriate socio-economic value to estimate the benefit of the per capita risk reductions. Both the reduction in per capita risks and the estimated per capita welfare benefits are then multiplied by the exposed population to determine the estimated number of avoided health events and the total economic value of the health benefits, for each census division in Canada. These are then aggregated by census division to calculate provincial and national health impacts and benefits.
Footnote 43
Others include biomass, wind, hydro, solar, and waste.
Footnote 44
Note that Canadian totals include all jurisdictions in Canada.
Footnote 45
Non-emitting = Biomass + geothermal + hydro + landfill gases/waste + nuclear + solar + wave + wind
Footnote 46
Non-emitting = Biomass + geothermal + hydro + landfill gases/waste + nuclear + solar
Footnote 47
Net imports = imports – exports. Increase in net imports means increase in imports and/or decrease in exports.
Footnote 48
Note that totals include all jurisdictions in Canada.
Footnote 49
Under the CBA, generation costs for exports are borne by the generating province.
Footnote 50
This figure represents the gross reductions from the utility sector relative to the BAU. For net reductions after accounting for GHGs, which result from increased extraction of oil and gas, see Table 22.
Footnote 51
Contact Environment Canada’s Economic Analysis Directorate for any questions regarding methodology, rationale, or policy.
Footnote 52
U.S. Interagency Working Group paper on SCC: IWGSCC, 2010, “Social Cost of Carbon for Regulatory Impact Analysis Under Executive Order 12866,” U.S. government.
Footnote 53
The value of $26/tonne of CO2 in 2010 (in 2010 Canadian dollars) and its growth rate have been estimated using an arithmetic average of the three models PAGE, FUND, and DICE.
Footnote 54
“Fat-Tailed Uncertainty in the Economics of Climate Change,” Review of Environmental Economic Policy, 5(2), 275–292 (summer 2011).
Footnote 55
“Fat Tails, Thin Tails, and Climate Change Policy,” Review of Environmental Economics and Policy, summer 2011.
Footnote 56
The value of $104/tonne of CO2 in 2010 (in 2010 Canadian dollars) and its growth rate have been estimated using an arithmetic average of the two models PAGE and DICE. The FUND model has been excluded in this estimate because it does not include low probability, high-cost climate damage.
Footnote 57
The emission factors are based on NPRI 2007, and hence often differ at the unit level. Projected increases in new generation are calibrated to historical national inventory levels.
Footnote 58
The average is the emission levels weighted based on the population of the census regions.
Footnote 59
The health outcomes shown in Table 18 are statistical estimates, based on the overall changes in per capita risks. For example, the AQBAT model predicts that over the period 2015–2035 the Regulations would reduce mortality risks in Manitoba, resulting in an estimated approximately 80 fewer premature deaths in the province. However, this does not mean that there will be 80 specific, identifiable individuals who will be “saved” in Manitoba. Thus, the “health benefits” of the Regulations are not the number of lives “saved” per se, but rather the reduction in the average per capita risk. Similarly, the values in the economic benefit column do not measure the benefit of the individual lives saved, or hospitalizations prevented. Rather, this is the aggregated benefit of the reduction in individual risk levels across the province.
Footnote 60
Individual numbers may not necessarily add up to totals due to rounding.
Footnote 61
Individual numbers may not necessarily add up to totals due to rounding.
Footnote 62
These totals include other pollutant-related health benefits
Footnote 63
It is understood that there are critical differences in population distribution and mercury exposure between Canada and the United States, and as a result, U.S. values should be taken as rough approximations of Canadian benefits only.
Footnote 64
Present values are calculated using a 3% discount rate.
Footnote 65
Individual numbers may not necessarily add up to totals due to rounding.
Footnote 66
The benefits assessment by AQVM2 was based on the comparison of a baseline scenario against an alternative policy scenario. The ambient air quality was modelled by AURAMS for each scenario, and the environmental benefits were estimated from the incremental difference between both scenarios.
Footnote 67
The deciview is a visual index designed to be linear with respect to perceived visual air quality changes over its entire range. The deciview scale is zero for pristine conditions and increases as visibility degrades. A change in deciview represents a perceptible change in visual air quality.
Footnote 68
The Census of Agricultural Regions dataset does not cover northern Saskatchewan, Yukon, Nunavut, and the Northwest Territories. Even though little agricultural activity is expected to occur in the three latter regions, the exclusion of northern Saskatchewan may lead to an underestimation of the national benefits, as this province already has about 37% of the total benefits for agriculture. Current agricultural data does not allow an assessment of the magnitude of the underestimation.
Footnote 69
Mean marginal damages (in 2010 dollars/tonne) are calculated as follows: NOx (timber) = $4.85; NO x (recreation) = $2.91; SO2 (material) = $12.30. The cumulative NOx and SOx emission reductions for the 2015–2035 period are respectively 546 kilotonnes and 1 156 kilotonnes.
Footnote 70
The socio-economic cost per tonne ratio is calculated by subtracting the present value of the sum of all non-GHG benefits from the present value of the costs of the Regulations, and then dividing by the present value of the tonnes of CO2.
Footnote 71
In Alberta, producer response and the timing of new generation influence the retail price. The model predicts that the supply generation brought into service over the 2023 to 2025 period creates a surplus in light of the demand conditions. This results in the average electricity price under the high natural gas price scenario being somewhat lower than the reference scenario.
Footnote 72
Personal disposable income is the amount of income left after payment of personal direct taxes, including income taxes, contributions to social insurance plans (such as the Canadian Pension Plan and Employment Insurance) and other fees.
Footnote 73
National Energy Board, www.neb-one.gc.ca/clf-nsi/rnrgynfmtn/nrgyrprt/nrgdmnd/ndstrlnrgscnd2010/ndstrlnrgscnd-eng.html#s3
Footnote 74
Power Advisory LLC, Assessment of Impacts on Electricity Prices in Alberta from Retirement of Coal-Fired Plants from the Regulations for Reduction of Carbon Dioxide Emissions from Coal-Fired Generation of Electricity, March 28, 2012.
Footnote 75
Ziff Energy Group, NOVA SCOTIA GAS MARKET ASSESSMENT, Impact of Gas Performance Standard, April 2012.
Footnote 76
Environment Canada’s Compliance and Enforcement Policy is available at www.ec.gc.ca/alef-ewe/default.asp?lang=en&n=AF0C5063-1.