
Vol. 148, No. 25 — December 3, 2014
Registration
SOR/2014-265 November 21, 2014
CANADIAN ENVIRONMENTAL PROTECTION ACT, 1999
Order Declaring that the Reduction of Carbon Dioxide Emissions from Coal-fired Generation of Electricity Regulations Do Not Apply in Nova Scotia
P.C. 2014-1268 November 20, 2014
Whereas, pursuant to subsection 332(1) (see footnote a) of the Canadian Environmental Protection Act, 1999 (see footnote b), the Minister of the Environment published in the Canada Gazette, Part I, on June 28, 2014, a copy of the proposed Order Declaring that the Reduction of Carbon Dioxide Emissions from Coal-fired Generation of Electricity Regulations Do Not Apply in Nova Scotia, substantially in the annexed form, and persons were given an opportunity to file comments with respect to the proposed Order or to file a notice of objection requesting that a board of review be established and stating the reasons for the objection;
And whereas, on May 26, 2014, the Minister of the Environment and the Government of Nova Scotia have entered into a written agreement referred to in subsection 10(3) of that Act to the effect that there are in force by or under the laws of Nova Scotia
- (a) provisions that are equivalent to the provisions of the Reduction of Carbon Dioxide Emissions from Coal-fired Generation of Electricity Regulations made under subsection 93(1) of that Act, and
- (b) provisions that are similar to sections 17 to 20 of that Act for the investigation of alleged offences under environmental legislation of Nova Scotia;
Therefore, His Excellency the Governor General in Council, on the recommendation of the Minister of the Environment, pursuant to subsection 10(3) of the Canadian Environmental Protection Act, 1999b, makes the annexed Order Declaring that the Reduction of Carbon Dioxide Emissions from Coal-fired Generation of Electricity Regulations Do Not Apply in Nova Scotia.
ORDER DECLARING THAT THE REDUCTION OF CARBON DIOXIDE EMISSIONS FROM COAL-FIRED GENERATION OF ELECTRICITY REGULATIONS DO NOT APPLY IN NOVA SCOTIA
DECLARATION
Non-application
1. The Reduction of Carbon Dioxide Emissions from Coal-fired Generation of Electricity Regulations do not apply in Nova Scotia.
COMING INTO FORCE
July 1, 2015
2. This Order comes into force on July 1, 2015.
REGULATORY IMPACT ANALYSIS STATEMENT
(This statement is not part of the Order.)
1. Executive summary
Issues: Protection of the environment is an area of shared jurisdiction in Canada. Both the Government of Canada and the Government of Nova Scotia have implemented regulations to control greenhouse gas (GHG) emissions from the electricity sector.
The Canadian Environmental Protection Act, 1999 (CEPA 1999) allows the Governor in Council to make an order in council (OiC) suspending the application of a federal regulation in a province or territory, on the recommendation of the Minister of the Environment, provided that certain conditions under CEPA 1999 are met. For this to occur, the province or territory must first enter into an equivalency agreement with the Government of Canada. Environment Canada (EC) is open to entering into equivalency agreements on industrial GHG regulations with interested provinces or territories as a means of minimizing regulatory duplication as per the Cabinet Directive on Regulatory Management, provided that the conditions under CEPA 1999 are met. (see footnote 1)
The governments of Canada and Nova Scotia have finalized a written equivalency agreement for the period 2015–2019. The equivalency agreement declares that provisions under Nova Scotia’s Environment Act and Greenhouse Gas Emissions Regulations (the NS GHG regulations) are equivalent in effect to the provisions of CEPA 1999 and the Reduction of Carbon Dioxide Emissions from Coal-fired Generation of Electricity Regulations (the federal regulations on GHG emissions from coal-fired electricity generation). As part of this agreement, the Government of Nova Scotia amended its Greenhouse Gas Emissions Regulations to include caps on GHG emissions from the province’s electricity sector for the years 2021–2030.
In order to avoid regulatory duplication and financial burden for the electricity producer in the province, the Minister of the Environment is recommending that the Governor in Council make an order in council suspending the application of the federal regulations on GHG emissions from coal-fired electricity generation in Nova Scotia. This equivalency agreement represents the first on GHG regulations.
Description: The Order in Council (the OiC) is a written declaration stating that the federal regulations on GHG emissions from coal-fired electricity generation do not apply in Nova Scotia.
Cost-benefit statement: The results of the analysis are expressed in 2010 dollars and are discounted at 3% to 2015, as this is the year in which the performance standard prescribed in the federal regulations on GHG emissions from coal-fired electricity generation comes into force. Overall, the OiC, together with the 2021–2030 provincial GHG emission caps, adopted in Nova Scotia in order to fulfill conditions of the equivalency agreement, is expected to result in a net reduction of three megatonnes of carbon dioxide equivalent (Mt CO2e) and a net reduction in costs of $87 million for the electricity sector in Nova Scotia. The OiC is expected to affect one electricity producer, who currently operates all coal-fired units in the province.
When the federal regulations on GHG emissions from coal-fired electricity generation are suspended, the electricity producer will have the flexibility to continue to operate coal-fired units that would otherwise have been closed under the federal regulations on GHG emissions from coal-fired electricity generation. However, the electricity producer is expected to reduce generation from coal-fired units and natural gas units in order to meet the 2021–2030 provincial GHG emission caps. This reduced generation is expected to be compensated for by additional electricity imports from Newfoundland and Labrador, which reduces the electricity available for export from Canada to the United States, resulting in foregone electricity exports.
The net present value (NPV) of the OiC and the 2021–2030 provincial GHG emission caps over the period 2015–2030 is estimated to be about $175 million. (see footnote 2) The present value (PV) of the benefits is estimated to be about $297 million, due to avoided fuel costs of about $109 million, benefits from GHG reductions of about $88 million, avoided capital investment costs of about $21 million, avoided decommissioning costs of about $50 million, and avoided variable and fixed operating and maintenance (O&M) costs of about $29 million. (see footnote 3)
The present value of the costs of the OiC and the 2021–2030 provincial GHG emission caps is estimated to be about $122 million, due to foregone net electricity exports ($50 million), additional coal-fired unit refurbishment costs ($39 million), and additional fixed O&M costs ($33 million).
Distributional analysis: The OiC and the 2021–2030 provincial GHG emission caps are expected to result in slightly higher electricity prices for the residential and industrial sectors with an estimated average annual price increase of 0.04 cents/kWh over the 2015–2030 period. As a result, impacts on monthly household electricity costs (an estimated increase of about $0.37/month) and industry competitiveness are expected to be negligible.
“One-for-One” Rule and small business lens: The OiC is expected to reduce administrative costs to the electricity producer by approximately $870 in present value, which is equivalent to an annualized value of about $120, as the electricity producer is no longer be required to report to the federal government.
No small business is expected to be affected by the OiC. The affected electricity producer in the province is considered a large business.
Domestic and international coordination and cooperation: The governments of Canada and Nova Scotia have been working to cooperate on addressing GHG emissions since 2009. In January 2010, the federal Minister of the Environment and the Nova Scotia Minister of Environment signed the Canada-Nova Scotia Agreement in Principle on Efforts to Address Climate Change (AiP). The AiP was developed with a view towards an eventual equivalency agreement, as provided for under CEPA 1999. Environment Canada and Nova Scotia announced their intent to work towards an equivalency agreement in respect of the federal regulations on GHG emissions from coal-fired electricity generation in March 2012. In September 2012, EC published a notification in the Canada Gazette, Part I, that a draft equivalency agreement was available for public comment for 60 days.
Extensive bilateral consultations were held with Nova Scotia government officials and with representatives from the affected company, focusing on key policy and technical parameters used in support of the cost-benefit analysis. Technical consultations focused on parameters related to electricity generation forecasts in the province for integration into the Energy, Emissions and Economy Model for Canada used by Environment Canada to model domestic GHG emissions.
2. Background
Greenhouse gases contribute to climate change, and the most significant source of anthropogenic GHG emissions is the combustion of fossil fuels. In 2012, the latest year of emissions data available under Canada’s National Inventory Report, Canada’s total GHG emissions was estimated to be 699 Mt CO2e. Of this total, 86 Mt CO2e, or about 10% of Canada’s total GHG emissions, were attributed to Canada’s electricity sector. (see footnote 4) Eight Mt CO2e, about 1% of Canada’s total GHG emissions, were attributed to Nova Scotia’s electricity sector.
2.1 Federal regulatory measures
In 2009, the Government of Canada committed to a national GHG reduction target of 17% below 2005 levels by 2020, and inscribed this in the Copenhagen Accord. The 2020 target is aligned with that of Canada’s largest trading partner, the United States.
The Government of Canada is implementing a sector-by-sector regulatory approach to reducing GHG emissions in major-emitting sectors. Given the highly integrated North American economy, the Government of Canada is aligning its climate change approach with that of the United States, as appropriate for Canadian circumstances. The sector-by-sector approach makes it possible to tailor regulations to sector-specific circumstances, integrating environmental and economic considerations. Regulations are being designed to provide regulatory certainty for industry, drive investments in clean energy technologies, and leverage capital stock turnover to minimize costs and consumer impacts.
In August 2012, the Reduction of Carbon Dioxide Emissions from Coal-fired Generation of Electricity Regulations were formally adopted, and in September 2012, they were published in the Canada Gazette, Part II. (see footnote 5) The emissions intensity limit in these Regulations comes into force on July 1, 2015. The Regulations set a stringent performance standard of 420 tonnes of carbon dioxide per gigawatt-hour (tCO2/GWh) of electricity produced for new coal-fired electricity generation units and those that have reached the end of their useful life.
A unit’s useful life is defined by the federal regulations on GHG emissions from coal-fired electricity generation as the period that begins on the commissioning date of the unit and that ends,
- in the case of a unit commissioned before 1975, 50 years after its commissioning or at the end of 2019, whichever comes earlier;
- in the case of a unit commissioned after 1974 but before 1986, 50 years after its commissioning or at the end of 2029, whichever comes earlier; and
- in any other case, 50 years after its commissioning.
These Regulations are expected to result in the closure of coal-fired units once they have reached the end of their useful life, unless they employ carbon capture and storage (CCS) technology or combust biomass. Therefore, these Regulations are expected to result in a shift to lower- or non-emitting types of generation, such as high-efficiency natural gas, renewable energy or fossil fuel-fired power with CCS.
2.2 Provincial regulatory measures
In 2009, as part of its approach to achieve a GHG reduction target of 10% below 1990 levels by 2020, the Government of Nova Scotia adopted the Greenhouse Gas Emissions Regulations (the NS GHG regulations), which imposed specific GHG emission caps from 2010–2020 on facilities that emit more than 10 000 metric tonnes of CO2e annually. In September 2013, Nova Scotia amended these Regulations to include increasingly stringent GHG emission caps for the 2021–2030 period.
These GHG emission caps are expected to be achieved through measures to manage both the supply and demand sides of electricity. On the supply side, Nova Scotia amended its Renewable Electricity Regulations in January 2013 to require that 25% of total electricity sales come from renewable resources, either from the province’s renewable generation and/or imports of renewable energy, by 2015, and 40% come from renewable resources by 2020 and onward. Particularly, Nova Scotia plans to import electricity from Newfoundland and Labrador through the Maritime Link starting in 2017. On the demand side, Nova Scotia has implemented Demand Side Management (DSM) Plans to reduce energy use through energy efficiency and conservation.
2.3 Equivalency agreements on industrial GHG regulations
As federal and provincial governments have a shared responsibility to protect the Canadian environment, CEPA 1999 includes the use of equivalency agreements as a tool for minimizing regulatory duplication and offering flexibility in achieving equivalent policy outcomes.
Section 10 of CEPA 1999 allows the Governor in Council, on the recommendation of the Minister of the Environment, to make an order in council suspending the application of a federal regulation in a province or territory. For this to occur, the province or territory must first enter into an equivalency agreement with the Government of Canada. An equivalency agreement is a written agreement signed by the federal Minister of the Environment and the province or territory declaring that there are in force in the province or territory laws containing provisions that are equivalent in effect to the federal regulations in question and provisions that are similar to sections 17 and 20 of CEPA 1999 for the investigation of alleged offences.
Environment Canada has indicated that it is open to developing equivalency agreements for industrial GHG regulations with interested provinces and territories, in order to minimize regulatory duplication. In the case of GHG regulations, provisions are considered to be equivalent if they result in an equivalent effect on GHG outcomes. In particular, GHG emission levels under provincial or territorial regulations must be no greater than they would be if the federal regulation applied, over the period for which the equivalency agreement would be in place. This allows a province or territory to attain a GHG outcome equivalent to or better than what would have occurred under a federal regulation in a way that best suits its particular circumstances.
2.4 Equivalency agreement on GHG regulations with the Province of Nova Scotia
The Government of Canada and the Government of Nova Scotia have been working to cooperate on addressing GHG emissions since 2009. In January 2010, the federal Minister of the Environment and the Nova Scotia Minister of Environment signed the Canada-Nova Scotia Agreement in Principle on Efforts to Address Climate Change. The Agreement in Principle (AiP) was developed with a view towards an eventual equivalency agreement, as required under CEPA 1999.
In March 2012, EC and Nova Scotia announced their intent to work towards an equivalency agreement with respect to the federal regulations on GHG emissions from coal-fired electricity generation. In September 2012, EC published a notice in the Canada Gazette, Part I, indicating that the draft Agreement of the Equivalency of Federal and Nova Scotia Regulations for the Control of Greenhouse Gas Emissions from Electricity Producers in Nova Scotia (the equivalency agreement) was available for public comment for 60 days. The equivalency agreement was signed on May 26, 2014, and will come into force on July 1, 2015. Subsequently, in June 2014, EC published the proposed Order in Council in the Canada Gazette, Part I, for public comment for 60 days.
Although the equivalency agreement has a four and a half year lifetime (i.e. from July 1, 2015, to December 31, 2019), the Government of Canada wanted to be satisfied that the NS GHG regulations would continue to result in a GHG emissions outcome equivalent to what would have occurred under the federal regulations on GHG emissions from coal-fired electricity generation after 2019. The aim is to provide regulatory certainty, over the longer term, to allow industry to make informed investment decisions and to facilitate the renewal of the equivalency agreement following its initial four and a half year term. This approach mitigates the risk that the NS GHG regulations would not be deemed to have an equivalent effect on GHG emissions in the future, resulting in the sudden application of the federal regulations on GHG emissions from coal-fired electricity generation in the province. Such a situation could lead to immediate closures of coal-fired plants, disruption to Nova Scotia’s electricity supply, and/or a possible situation of non-compliance with the federal regulations on GHG emissions from coal-fired electricity generation, for which the province’s electricity producer could face large fines and penalties.
As a condition of the agreement, Nova Scotia amended its GHG regulations in September 2013 to include GHG emission caps for the electricity sector, from 2021 to 2030, that are projected to have an effect equivalent to the projected effect of the federal regulations on GHG emissions from coal-fired electricity generation over the same period. These caps on electricity sector emissions are expected to be met by decreasing coal-fired electricity generation and replacing that capacity with increased renewable electricity generation, including through imports of hydroelectric power from Newfoundland and Labrador, as well as DSM Plans.
Table 1 below shows the provincial GHG emission caps from 2010 to 2030. Note that in some periods, the cap is set cumulatively over a number of years, while in others, the cap is placed on a single year’s GHG emissions. On average, the provincial GHG caps are declining and therefore becoming more stringent on an annual basis.
Table 1: Nova Scotia provincial caps on GHG emissions
| Calendar Years | 2010–2011 | 2012–2013 | 2014–2016 | 2017–2019 | 2020 | 2021–2024 | 2025 | 2026–2029 | 2030 |
|---|---|---|---|---|---|---|---|---|---|
| Emission Cap for All Facilities in Nova Scotia (Million of Tonnes of CO2e) | 19.22 | 18.5 | 26.32 | 24.06 | 7.5 | 27.5 | 6 | 21.5 | 4.5 |
Source: Nova Scotia Environment Act, S.N.S. 1994-95, subsection 28(6) and section 112, c. 1, O.I.C. 2009-341 (August 14, 2009), N.S. Reg. 260/2009, as amended by O.I.C. 2013-332 (September 10, 2013), N.S. Reg. 305/2013.
3. Issues
Nova Scotia has adopted GHG regulations that are equivalent in effect to the performance standard imposed under the federal regulations on GHG emissions from coal-fired electricity generation. It also has in force provisions under its environmental legislation that are similar to sections 17 to 20 of CEPA 1999 for the investigation of alleged offences.
As per CEPA 1999 requirements, the two levels of government have developed an equivalency agreement that will allow the federal government to stand down its regulations in the province, reducing regulatory duplication and financial burden, while still ensuring that GHG emissions generated by the electricity sector in Nova Scotia are no higher than they would have been under the federal regulations on GHG emissions from coal-fired electricity generation.
In the absence of further action, the electricity producer in the province would be subject to both the federal regulations on GHG emissions from coal-fired electricity generation and the NS GHG regulations. These two regulatory regimes are expected to yield equivalent GHG emissions in the electricity sector. However, together they impose regulatory requirements that are expected to result in avoidable financial and administrative burden for the electricity producer in Nova Scotia and administrative burden for the federal government. This provides a justification for government intervention through an order in council to suspend the application of the federal regulations on GHG emissions from coal-fired electricity generation in Nova Scotia.
4. Objectives
The objective of the OiC is to minimize regulatory duplication and financial burden for the electricity producer in Nova Scotia by suspending the application of federal regulations on GHG emissions from coal-fired electricity generation in Nova Scotia. This is in line with the federal Cabinet Directive on Regulatory Management, which, among other objectives, commits to controlling administrative burden and minimizing regulatory duplication throughout the regulatory process.
5. Description
The OiC, made pursuant to subsection 10(3) of CEPA 1999, is a declaration stating that the Reduction of Carbon Dioxide Emissions from Coal-fired Generation of Electricity Regulations do not apply in Nova Scotia, effective July 1, 2015.
6. Sector profile
The OiC will suspend the application of the federal regulations on GHG emissions from coal-fired electricity generation in Nova Scotia. To assist in understanding the scope and impacts of the OiC, the following analysis provides a profile of Nova Scotia’s electricity generation sector. It also examines some of the key features of the sector relating to generation capacity and fuel mix, interprovincial electricity flows, and electricity demand, all of which have a bearing on the assessment of the impacts of the OiC.
Unless otherwise indicated, data presented here is drawn from Environment Canada’s Energy, Emissions, and Economy Model for Canada (E3MC).
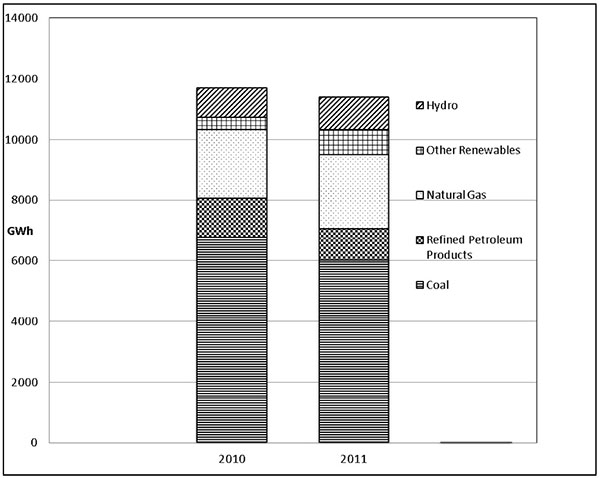
Nova Scotia’s electricity generation sector is composed of utility and non-utility generators that produce electricity by transforming the energy in coal, natural gas, water, petroleum coke, and wind into electricity. The process of supplying electricity to the public involves not only power generation at the plant, but also distribution through the electricity grid. Figure 1 below shows the generation by major fuel types in Nova Scotia in 2010 and 2011.
Overall, the total electricity generation in Nova Scotia in 2011 was 11 400 gigawatt hours (GWh), of which 53% was produced by coal, 21% by natural gas, 9% by hydro, and 9% by refined petroleum products, while other sources such as wind or solar accounted for the remaining 7%.
Figure 1: Generation by major fuel types in Nova Scotia
Nova Scotia’s electricity market is regulated by the Nova Scotia Utility and Review Board (NSUARB). The NSUARB has regulatory oversight over public utilities. Electricity prices are set by the NSUARB to cover generation costs and allow for a reasonable rate of return to investors.
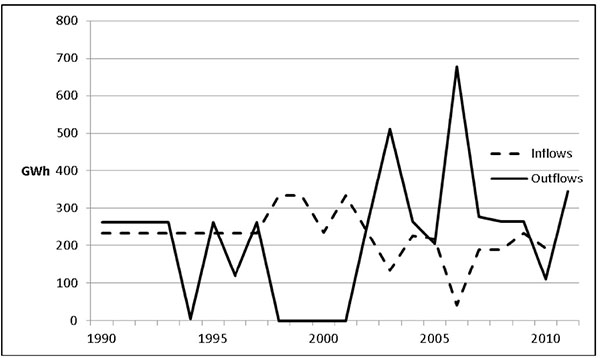
The interconnectedness of Nova Scotia’s electricity grid with Newfoundland and Labrador and New Brunswick would allow Nova Scotia to have electricity inflows and outflows in response to demand conditions in these three provinces. Figure 2 below shows the historical trends of the electricity flow in and out of Nova Scotia.
Figure 2: Nova Scotia electricity inflows and outflows from New Brunswick
Nova Scotia has reached an agreement with Newfoundland and Labrador to receive part of the generation from the Muskrat Falls Hydroelectric Project (Muskrat Falls). Nova Scotia would receive 20% of the energy from Muskrat Falls for 35 years (the “base block,” about 0.9 terawatthours [TWh]), and a supplemental 0.2 TWh/year for the first five years of the agreement (supplemental blocks). (see footnote 6) The electricity producer would then be able to purchase additional hydroelectric energy at market rates. These imports to Nova Scotia would begin in 2017 and continue onwards, as needed.
In addition, Nova Scotia is expected to continue trade flows with New Brunswick, the magnitude of which is dependent on the generation and market conditions within Nova Scotia.
Currently, the Nova Scotia electricity generation sector takes advantage of a full mix of hydro, coal, natural gas, wind and other available generating sources. At the same time, actual generation from all these sources is significantly less than potential generation. Potential generation can be determined by assuming capacity is fully operational for each hour, over the entire year. The difference between potential and actual generation can be due to numerous factors, such as required maintenance schedules.
Table 2 shows the actual generation, potential generation and capacity utilization level for major generation types as an average over the five-year period of 2007–2011. Coal-fired units had the highest capacity utilization level in 2011, with actual generation at over 70% of full capacity. This was followed by hydro, natural gas, and wind unit generation, while other sources, such as wave and solar energy, had relatively low levels of utilization.
Table 2: Nova Scotia actual vs. potential generation — average over 2007–2011 (see footnote 7)
| Type | Actual Generation (GWh) | Potential Generation (GWh) | Capacity Utilization (Actual/Potential) |
|---|---|---|---|
| Coal | 8 285 (see note 1*) | 11 300 | 73% |
| Natural gas | 1 695 | 6 330 | 27% |
| Hydro | 1 005 | 3 540 | 28% |
| Wind | 326 | 2 920 | 11.1% |
| Total | 11 618 | 24 090 | 48% |
Note 1* Includes generation from both coal and petroleum coke.
Nova Scotia has a total of eight coal units, two of which would reach their end of useful life, as defined by the federal regulations on GHG emissions from coal-fired electricity generation, by 2022, and four by 2030. The remaining two units are not expected to be affected by the OiC during the analysis period as they are expected to reach their end of useful life in 2041 and 2044, respectively. Nova Scotia’s 2009 Climate Change Action Plan and 2009 Energy Strategy commit the province to undertaking an orderly transition from coal to cleaner and more sustainable energy sources. (see footnote 8) Subsequent to these, the Government of Nova Scotia amended its Renewable Electricity Regulations in January 2013 to require that 25% of total electricity sales come from renewable resources, either from the province’s renewable generation and/or imports of renewable energy, by 2015 and that 40% come from renewable resources by 2020 and onward. (see footnote 9) Moreover, the NS GHG regulations have also been adopted and cap emissions from the electricity generation sector, which will result in reduced use of fossil fuels (primarily coal and petroleum coke).
Major consumers of electricity are shown in Table 3. The largest consuming sectors in Nova Scotia in 2011 were residential (39%), followed by commercial (32%) and industrial (29%). (see footnote 10) Only a small proportion of electricity was consumed by the transportation sector in 2005, and consumption decreased to zero in 2008 and 2011.
Table 3: Electricity consumption by sector in Nova Scotia, 2005–2011 (GWh)
| 2005 | 2008 | 2011 | |
|---|---|---|---|
| Industrial | 4 269 | 4 252 | 3 157 |
| Residential | 4 131 | 4 211 | 4 357 |
| Commercial | 3 210 | 3 342 | 3 520 |
| Transportation | 6 | 0 | 0 |
| Total | 11 616 | 11 806 | 11 035 |
In 2012, the Bowater Mersey pulp and paper mill and the Minas Basin pulp and paper mill in Nova Scotia were closed indefinitely. As pulp and paper mills are highly energy intensive, the closure of these two mills has resulted in decreased consumption of electricity in Nova Scotia, which has lessened the pressure on demand within the province.
7. Regulatory and non-regulatory options considered
Given that CEPA 1999 section 10 requirements have been met in regard to the federal regulations on GHG emissions from coal-fired electricity generation in the province, an OiC has been implemented.
An OiC is the only regulatory instrument that allows the Governor in Council to suspend the application of the federal regulations on GHG emissions from coal-fired electricity generation in Nova Scotia. Application of this instrument for this purpose is in line with Government of Canada objectives to coordinate the implementation and management of regulations to minimize complexity and duplication, and to cooperate with relevant jurisdictions to manage any cumulative impacts and minimize conflicting requirements.
Non-regulatory options, such as a voluntary option or code of practice, are therefore not suitable tools for achieving the objective.
8. Cost-benefit analysis
The cost-benefit analysis (CBA) was performed using modelling results from EC’s E3MC. Although based on the best information currently available, these results present one possible scenario which, like all long-term projections, is subject to uncertainty regarding specific projections, e.g. regarding specific new plants, retirements, generation mix, or other data and assumptions.
The objective of the CBA is to assess the impacts that are expected to occur over and above those that would have occurred in the absence of the OiC. To this end, two scenarios were developed: the business-as-usual (BAU) scenario and the regulatory scenario (see below for full scenario definitions). The BAU scenario portrays what the electricity sector in Nova Scotia would look like without the OiC, which means the application of the federal regulations on GHG emissions from coal-fired electricity generation in Nova Scotia and no provincial GHG emission caps after 2020. The regulatory scenario portrays what the electricity sector would look like with the application of the federal regulations on GHG emissions from coal-fired electricity generation suspended in Nova Scotia and with the application of provincial GHG emission caps between 2021 and 2030. The incremental impacts were measured by comparing these two scenarios, and the contribution of the OiC and the provincial GHG emission caps from 2021–2030 was then assessed.
Incremental impacts have been monetized to the extent possible. Where this was not possible, due to either lack of appropriate data or difficulties in valuing certain components, incremental impacts were evaluated in qualitative terms.
The study period used for evaluating the incremental impacts is 16 years (2015–2030). Unless otherwise stated, all monetized values presented are discounted at 3% to 2015, as it is the year in which the federal regulations on GHG emissions from coal-fired electricity generation come into force. All values are expressed in 2010 Canadian dollars.
8.1 Summary
Under the BAU scenario, the electricity producer is expected to close its coal-fired units once they have reached the end of their useful life in responding to the federal regulations on GHG emissions from coal-fired electricity generation. The electricity producer is currently operating eight coal-fired units with a total capacity of 1 308 megawatts (MW), two of which would be retired by 2022, four of which would be retired in 2030, and two of which would be retired after 2040. In sum, six of the eight coal-fired units are expected to be retired by 2030, which is the last year of the analytical period for this cost-benefit analysis.
Under the regulatory scenario, the electricity producer is expected to continue to operate most of its coal-fired units over the analytical period. In order to meet the provincial GHG emission caps for the period 2021–2030, the electricity producer is expected to retire one of its coal-fired units and reduce its generation from existing coal-fired and natural gas units.
The suspension of the federal regulations on GHG emissions from coal-fired electricity generation and the implementation of the provincial 2021–2030 caps together are expected to result in a net reduction of generation from coal-fired and natural gas units and a net reduction of approximately 3 Mt CO2e of GHG emissions, avoided capital investment, avoided generation costs for the electricity producer, and forgone electricity exports. This is because the electricity producer would not be able to significantly increase utilization rates of the existing coal-fired units and natural gas units due to the 2021–2030 GHG emission caps, as they would have done under the BAU scenario, in which case coal plants can continue to operate without restrictions until they reach the end of their useful life. This constraint reflects the binding nature of the provincial GHG emission caps after 2020.
In summary, the net present value of the OiC and the 2021–2030 provincial GHG emission caps over the study period is estimated to be about $175 million. (see footnote 11) The present value of the benefits is estimated to be about $297 million, largely due to the avoided generation costs ($159 million), the incremental benefits from GHG reductions ($88 million), and avoided decommissioning costs ($50 million). The present value of the costs is estimated to be about $122 million, largely due to foregone net foreign exports ($50 million), net refurbishment costs ($39 million), and additional fixed O&M costs associated with refurbished coal units ($33 million). Overall, the estimated benefits of the OiC and the 2021–2030 provincial GHG emission caps are expected to outweigh the estimated costs by a ratio of 2.5:1.
It should be noted that the scope of the analysis is national as per Treasury Board Secretariat’s Canadian Cost-Benefit Analysis Guide: Regulatory Proposals (TBS Guide). (see footnote 12) It is not expected that the OiC and the 2021–2030 provincial GHG emission caps would have any significant incremental impacts on the generation from the electricity sector in the neighboring provinces such as New Brunswick and Quebec. However, some changes in net foreign exports are expected to occur, which are discussed in section 8.5.7.
The OiC and the 2021–2030 provincial GHG emission caps are expected to have an impact on the level of air pollutant emissions. These changes in air pollutant emissions are expected to be small and are therefore not expected to have significant health or environmental effects over the 2015 to 2030 period.
8.2 Analytical framework
8.2.1 Scope of the analysis
The cost-benefit analysis assesses the incremental impacts of the OiC and the 2021–2030 provincial GHG emission caps on the electricity generation sector in Canada. The CBA is national in scope and takes a societal perspective as per the TBS Guide.
8.2.2 Time frame for analysis
The study period used for evaluating the incremental impacts is 16 years (2015–2030). The first year of the analysis is 2015, when the OiC is expected to come into force. The last year of the analysis is 2030, consistent with the time frame of the amendments made to Nova Scotia’s regulations to enter into the equivalency agreement for the control of GHG emissions from the electricity sector in Nova Scotia.
8.2.3 Scenario definition and incremental impacts
Business-as-usual (BAU) scenario
The BAU scenario establishes what the electricity generation sector in the province will look like in the future if the OiC is not implemented. In this scenario, the federal regulations on GHG emissions from coal-fired electricity generation would continue to be in effect and the electricity producer would retire its coal-fired units at the end of their useful life. The electricity producer would also meet the renewable requirements (25% of total sales from renewable sources in 2015 and 40% by 2020 and onward) and the provincial GHG caps over 2010–2020, as discussed in the “Background” section. Provincial GHG emission caps between 2021 and 2030 were amended as a condition of the equivalency agreement. As a result, the amended caps are not included in the BAU scenario. Other policies included in the BAU scenario are the provincial Air Quality Regulations, (see footnote 13) which require the electricity producer to meet the emission caps on various criteria air contaminants from fossil fuel-fired thermal power generating stations, and the DSM plan. (see footnote 14)
The policy requirements and the DSM plan were modelled using E3MC. As previously mentioned, E3MC results are derived from a set of data input and assumptions. Hence, the modelling results present one possible trajectory that the electricity producer could follow to satisfy the policy requirements. It should be noted that the electricity producer may employ a different response strategy, which could result in a different trajectory.
Table 4 below shows the schedule of coal-fired unit retirements (closures) under the BAU scenario. Overall, six coal-fired units with a combined capacity of 952 MW are expected to be retired by 2030. Of these six coal-fired units, two with a combined capacity of 330 MW are to be retired by 2022, and four with a combined capacity of 622 MW are to be retired in 2030. Consequently, the province is expected to experience some reduction of generation from coal-fired units starting in 2020, with the biggest reduction of generation in 2030. However, between 2021 and 2029, due to the fact that there would be no provincial GHG emission caps, the electricity producer is able to increase utilization rates of both coal-fired units and natural-gas units. The increased utilization rates of operating units makes up for some of the reduced generation from shutting down coal-fired units.
In addition, as the electricity sector has to meet the renewable requirement, new capacity from renewable resources is expected to significantly increase starting in 2015 or earlier. Therefore, generation from new renewable sources is also expected to displace some of the reduced generation from coal-fired units. As the renewable requirement increases to 40%, the electricity sector is expected to make more investments in renewable capacity, in addition to imports of renewable energy from Newfoundland and Labrador.
Table 4: Coal-fired unit retirements under the BAU scenario
| Retirement Year | Number of Units | Coal Capacity Retired (MW) |
|---|---|---|
| 2020 | 1 | 165 |
| 2022 | 1 | 165 |
| 2030 | 4 | 622 |
| Total | 6 | 952 |
Natural gas also plays an important role in the generation mix. Specifically, utilization rates of existing natural gas units are expected to increase as coal-fired units retire. This offsets, to a certain degree, the reduction in generation caused by coal-fired unit retirements prior to 2030. However, as there are four coal-fired unit retirements in 2030, new natural gas capacity is expected to be installed to offset the reduction of coal capacity.
In summary, the expected response strategy includes coal-fired unit retirements, increased utilization rates of existing coal-fired and natural gas units, new renewable and natural gas capital investments, and imports of renewable energy from Newfoundland and Labrador.
Regulatory scenario
The regulatory scenario establishes what the electricity generation sector is expected to look like with the implementation of the OiC. This scenario differs from the BAU scenario as follows: (1) the federal regulations on GHG emissions from coal-fired electricity generation are suspended, and (2) the provincial 2021–2030 GHG emission caps are in place. Given that the Government of Nova Scotia amended their regulations to include GHG emission caps for the 2021–2030 period as a condition of the equivalency agreement, these caps are incremental and hence incorporated in the regulatory scenario.
Although coal-fired units are now allowed to stay in operation, the electricity producer is expected to close one of its coal-fired units with a capacity of 165 MW. This unit was planned to be retired in 2022 under the BAU scenario, but is expected to be retired in 2018 under the regulatory scenario. (see footnote 15) Thus, even though none of the eight coal-fired units are obligated to shut down due to the suspension of the federal regulations on GHG emissions from coal-fired electricity generation, one unit will shut down and seven will remain in operation.
It should be noted that in this scenario, the electricity sector is also expected to meet the renewable energy requirement. It is expected that the electricity sector would follow a path similar to the one discussed in the BAU scenario in meeting the renewable energy requirement.
Incremental impacts of the OiC and the 2021–2030 provincial GHG emission caps
Standing down the federal regulations on GHG emissions from coal-fired electricity generation would allow the electricity producer to continue to operate coal-fired units reaching the end of their useful life that would otherwise have been closed in the BAU scenario at the end of their useful life. This flexibility is expected to result in avoided natural gas capacity investments. However, it is assumed that coal-fired units would need to be refurbished at the end of their useful life. Conversely, this means that they would not be decommissioned and thus decommissioning costs would be avoided. It should be noted that these are one-time costs and one-time avoided costs as the analysis covers the 2015–2030 period. Table 5 provides a summary of benefits and costs of the OiC and the 2021–2030 provincial GHG emission caps.
Furthermore, from 2015 to 2030, additional coal capacity leads to an additional fixed O&M cost relative to the BAU scenario. Conversely, relative to the BAU scenario, there is a reduction in natural gas capacity, which results in an avoided fixed O&M cost.
Also, prior to 2030, the electricity producer is expected to generate, relative to the BAU scenario, less electricity from coal-fired units and natural gas units in order to comply with provincial GHG emission caps for 2021–2030. Therefore, the electricity sector is expected to show a cumulative reduction in generation in Nova Scotia and correspondingly in Canada. It is also expected that Nova Scotia would need to rely more on importing renewable energy from the Muskrat Falls project in order to meet demand and the provincial renewable energy standards. This reduces, relative to the BAU scenario, the generation available for export to the United States from Muskrat Falls through New Brunswick, leading to an overall reduction in electricity exports. The reduction in generation from coal-fired units and natural gas units also leads to additional benefits from GHG emissions reduction, additional changes in air pollutant emissions, avoided fuel costs, avoided variable O&M costs associated with less reliance on coal-fired units and natural gas units.
It should be noted that variable O&M costs refer to the operations and maintenance costs incurred upon increasing the level of electricity production. Examples typically include minor unplanned maintenance, water usage, chemicals, limestone (where flue gas desulphurization is used), auxiliary energy use, and ash disposal costs.
Fixed O&M costs are costs that are associated with capacity and are not dependent on electricity production. Examples typically include all fixed operating costs, such as spares and major periodic maintenance.
Table 5: Benefits and costs of the OiC and the 2021–2030 provincial GHG emission caps
| Benefits | Costs |
|---|---|
Avoided generation costs
Avoided government costs Additional GHG emission reductions Additional air pollutant emission changes (see note 2*) |
Increases in generation costs
|
Note 2* Incremental impacts of emissions of air pollutant changes were not quantified or monetized.
8.2.4 Discount rate
A social discount rate of 3% is used in the analysis for estimating the present value of the costs and benefits in 2015. This is consistent with the Treasury Board Secretariat’s Canadian CostBenefit Analysis Guide and is what was used in the analysis for the federal regulations on GHG emissions from coal-fired electricity generation. The 3% discount rate is consistent with the discount rate used for other Canadian GHG regulations. Costs and benefits were discounted to 2015, the first year the OiC comes into effect. A sensitivity analysis of the discount rate was conducted to test the sensitivity of the results to alternate discount rates.
8.2.5 Residual value
Since the analytical period ends in 2030, the residual value of refurbishments is netted off after amortizing the initial costs over the expected lifetime of the investment such that only costs accrued within the analytical period are included in the calculations. A similar approach is adopted for avoided capital costs.
8.3 Economic tools, data and information sources
8.3.1 Production, energy use, and emissions
This analysis uses various sources, including a significant amount of data provided by Nova Scotia provincial officials and the electricity producer during the prepublication consultations. The analysis is based on the modelling results produced by EC using E3MC. E3MC has two components: Energy 2020, which models Canada’s energy supply and demand, and The Informetrica Model (TIM), a macroeconomic model of the Canadian economy. Long-term economic projections were developed through TIM, which was tuned to productivity growth projections and Statistics Canada’s population growth projections. Specifically, data on capacity, demand, generation, GHGs (CO2e), and air pollutants for both BAU and regulatory scenarios were populated from E3MC.
8.3.2 Fuel prices and emission factors
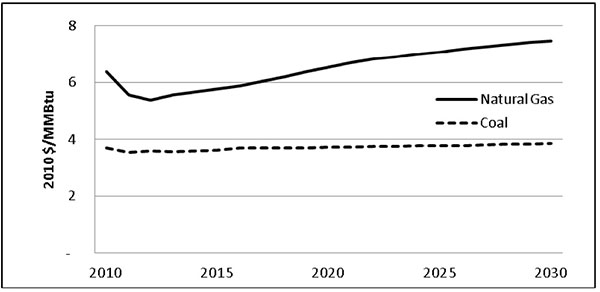
Projections of natural gas and coal prices to the utilities used in this analysis were generated by E3MC, and are based on historical natural gas and coal costs for the utility in Nova Scotia from Statistics Canada. (see footnote 16) The base year for the natural gas price is 2011, which is the last year where historical data is available, when the natural gas price was $5.57/MMBtu. The base year for the coal price is 2011, when the price was $3.55/MMBtu. The forecast for coal price uses the percentage changes of the U.S. Energy Information Administration’s mine-mouths’ coal price forecast. The forecast for the natural gas price follows the trend of the Henry Hub price. Adjustments were made to 2012–2013 historical natural gas data to account for the nature of the natural gas market in New England, where Nova Scotia purchases natural gas. (see footnote 17) Figure 3 below illustrates the coal and natural gas prices used for this analysis.
Figure 3: Fuel prices used in the analysis
8.3.3 Social cost of carbon
The estimated value of avoided damages from GHG reductions is based on the climate change damages avoided at the global level. These damages are usually referred to as the social cost of carbon (SCC). Estimates of the SCC between and within countries vary widely due to challenges in predicting future emissions, climate change, damages and determining the appropriate weight to place on future costs relative to near-term costs (discount rate) and foreign damages relative to domestic damages.
The SCC values used in this assessment draw on ongoing work undertaken by EC in collaboration with a federal interdepartmental working group, and in consultation with a number of external academic experts. (see footnote 18) This work involves reviewing existing literature and other countries’ approaches to valuing GHG emissions.
With the preliminary recommendations, based on current literature and in line with the approach adopted by the United States Interagency Working Group on the Social Cost of Carbon, (see footnote 19) it is reasonable to estimate SCC values at $28.15/tonne of CO2e in 2013, increasing each year with the expected growth in damages (see figure 4 below). (see footnote 20) Environment Canada’s review also concludes that a value of $111.55/tonne in 2013 should be considered, reflecting arguments raised by Weitzman (2011) (see footnote 21) and Pindyck (2011) (see footnote 22) regarding the treatment of right-skewed probability distributions of the SCC in cost-benefit analyses (see figure 4 below). (see footnote 23) Their argument calls for full consideration of low probability, high-cost climate damage scenarios in cost-benefit analyses to more accurately reflect risk. A value of $111.55/tonne does not, however, reflect the extreme end of SCC estimates, as some studies have produced values exceeding $1,000/tonne of carbon emitted.
The federal interdepartmental working group on SCC also concluded that it is necessary to continually review the above estimates in order to incorporate advances in physical sciences, economic literature, and modelling to ensure the SCC estimates remain current. Environment Canada will continue to collaborate with the federal interdepartmental working group and outside experts to review and incorporate, as appropriate, new research on SCC in the future.
Figure 4: SCC estimates (2010 Canadian dollars per tonne)
Source: Federal interdepartmental working group on the social cost of carbon.
8.3.4 Import and export prices of electricity
The price forecasts for imports and exports of electricity are calculated within E3MC and are based on the historical mix and outlook of future mix of short-term and long-term electricity export contracts. The prices of short-term and long-term electricity export contracts vary systematically; thus assumptions on the future contract mix will influence forecasted prices. Imports from the United States are based on the weighted average cost of power from the importing area.
8.4 Incremental impacts of the OiC and the 2021–2030 provincial GHG emission caps: Changes in demand, capacity, and generation
8.4.1 Demand
Under the BAU and regulatory scenarios, total demand for electricity is projected to increase from 9.9 terawatthours (TWh) in 2015 to 10.4 TWh in 2030 (Table 6), with minor differences between the two scenarios.
Table 6: Electricity demand (TWh) in Nova Scotia
year |
2015 | 2020 | 2025 | 2030 |
|---|---|---|---|---|
| BAU scenario | 9.932 | 9.963 | 9.999 | 10.411 |
| Regulatory scenario | 9.932 | 9.959 | 10.003 | 10.404 |
8.4.2 Capacity
1. Coal
There are a total of eight coal-fired generation units in Nova Scotia. Six of the eight units would have been affected by the federal regulations on GHG emissions from coal-fired electricity generation within the analytical timeframe; two others would reach their end of useful life after 2040.
Relative to the BAU scenario, coal-fired electricity generating capacity in the regulatory scenario is expected to be 787 MW higher in 2030 (see Table 7). This is due to the continued operation of five units that otherwise would have been closed under the federal regulations on GHG emissions from coal-fired electricity generation.
Note that one coal unit that would have closed under the BAU scenario in 2022 would still close in the regulatory scenario, but would close earlier in 2018. All other units that would have closed under the BAU scenario would remain in operation in the regulatory scenario.
Table 7: Coal-fired retirement schedule and capacity
| BAU scenario | Regulatory scenario | ||||
|---|---|---|---|---|---|
| Number of units | Capacity (MW) | Retirement year | Number of units | Capacity (MW) | Retirement year |
| 1 | 165 | 2020 | 1 | 165 | 2018 |
| 1 | 165 | 2022 | |||
| 4 | 622 | 2030 | |||
2. Natural gas
The continued operation of coal units is expected to affect investments in new natural gas capacity. Specifically, natural gas capacity is expected to increase by 700 MW in the BAU scenario between 2015 and 2030 due to coal-fired unit closures, while it only increases by 150 MW in the regulatory scenario over the same period. As a result, relative to the BAU scenario, natural gas capacity in the regulatory scenario is expected to be 550 MW less over the 16-year period (Table 8).
Table 8: Increases in natural gas capacity (MW), 2015–2030
year |
2015–2030 |
|---|---|
| BAU scenario | 700 (see note 3*) |
| Regulatory scenario | 150 |
| Incremental | –550 |
- Note 3* The majority occurs in the year 2030.
8.4.3 Generation
As coal plants are shut down and natural gas units are built in the BAU scenario, a change in the generation mix occurs. In contrast, in the regulatory scenario, coal plants are allowed to continue their operation and there is less need for natural gas plants; the generation mix is different from that in the BAU scenario.
Table 9 presents the cumulative generation for the periods of 2015–2020 and 2021–2030. It should be noted that in the BAU scenario, there is no provincial GHG emission cap from 2021 to 2030. Relative to the BAU scenario, coal generation in the regulatory scenario decreases by 1% over 2015–2020, and decreases by 6% over 2021–2030. In addition, natural gas generation increases by 1% between 2015 and 2020, but decreases by 2% over 2021–2030. This is due to the stringency of the provincial GHG caps between 2021 and 2030. Consequently, there would be a decrease in GHG emissions as a result of the decreased coal and natural gas generation relative to the BAU scenario.
The decrease in overall generation would be offset by Nova Scotia increasing imports of renewable electricity from the Muskrat Falls project in Newfoundland and Labrador. It should be noted that this increased import into Nova Scotia decreases the supply of electricity available to export to the United States.
Table 9: Electricity generation (TWh) by fuel type
| 2015–2020 | 2021–2030 | 2015–2030 | |||||||
|---|---|---|---|---|---|---|---|---|---|
| BAU scenario | Regulatory scenario | % Difference | BAU scenario | Regulatory scenario | % Difference | BAU scenario | Regulatory scenario | % Difference | |
| Coal (see note 4*) | 29.88 | 29.55 | –1% | 43.23 | 40.45 | –6% | 73.11 | 70.00 | –4% |
| Natural gas | 11.69 | 11.79 | 1% | 20.85 | 20.48 | –2% | 32.54 | 32.27 | –1% |
| Non-emitting (see note 5*) | 18.1 | 18.1 | 0% | 32.81 | 32.82 | 0% | 50.91 | 50.92 | 0% |
- Note 4* Coal generation includes generation from coal and petroleum coke.
- Note 5* Non-emitting = Biomass + geothermal + hydro + landfill gases/waste + nuclear + solar.
8.5 Costs and avoided costs to the electricity sector
8.5.1 Refurbishment costs and avoided decommissioning costs
Over the 2015 to 2030 time period, the OiC would allow coal units to continue their operation. However, as previously discussed, in order to remain in operation, coal-fired units would need to be refurbished at the end of their useful life. Since the analytical period ends in 2030, the residual value of the avoided refurbishments is netted off by amortizing the initial costs over the expected lifetime of the investment such that only benefits accrued within the study period are included in the calculations. Although the electricity producer is expected to incur the refurbishment costs, they are expected to avoid decommissioning costs as they no longer need to decommission those units.
An average refurbishment cost of $395,266/MW and an average decommissioning cost of $95,619/MW were assumed for the analysis. (see footnote 24)
The present value of net refurbishment costs is about $39 million and that of avoided decommissioning costs is about $50 million (see Table 10 below).
Table 10: Refurbishment costs and avoided decommissioning costs (present value in millions of 2010 dollars)
| Cost category | 2015 | 2020 | 2025 | 2030 | Cumulative (2015 to 2030) |
|---|---|---|---|---|---|
| Net refurbishment costs | 0.00 | 56.26 | 0.00 | 157.81 | 39.13 |
| Refurbishment of coal units | 0.00 | 56.26 | 0.00 | 157.81 | 214.06 |
| Residual value of refurbishments | -174.94 | -174.94 | |||
| Avoided decommissioning costs | 0.00 | 13.61 | 0.00 | 38.17 | -50.17 |
8.5.2 Avoided capital costs
As discussed in subsection 8.4.2, there is a net avoided natural gas capacity of 550 MW in the regulatory scenario relative to the BAU scenario. As a result, there is an expected avoided cost of about $371 million from 2015 to 2030. Netting out the residual present value of about $349 million, the electricity producer would save a present value of net capital costs of approximately $22 million between 2015 and 2030. (see footnote 25)
8.5.3 Additional and avoided fixed O&M costs
O&M costs associated with maintaining the capacity of the units are categorized as fixed O&M costs. As coal-fired electricity generating capacity is expected to be 787 MW higher, relative to the BAU scenario, additional fixed O&M costs associated with coal-fired units are expected to occur. Conversely, as natural gas generating capacity is expected to be 550 MW lower over the period 2015–2030, relative to the BAU scenario, avoided fixed O&M costs associated with avoided natural gas capacity are expected to occur. Together this yields a present value of net fixed O&M costs of about $14 million (see Table 11). This estimate is based on the assumed average fixed O&M cost of $17.42/kW/year for coal units in Nova Scotia and of $13.39/kW/year for natural gas units in Nova Scotia.
Table 11: Fixed O&M costs (present value in millions of 2010 dollars)
| Cost category | 2015 | 2020 | 2025 | 2030 | Cumulative (2015 to 2030) |
|---|---|---|---|---|---|
| Net fixed O&M | 0.00 | 0.00 | 1.10 | 5.27 | 14.47 |
| Additional fixed O&M | 0.00 | 2.44 | 2.11 | 10.01 | 33.32 |
| Avoided fixed O&M | 0.00 | –2.44 | –1.00 | –4.74 | –18.85 |
8.5.4 Avoided fuel costs
Compared to the BAU scenario, the electricity sector is expected to use less coal, which would result in overall avoided coal costs of approximately $98 million in present value. This avoided cost is calculated based on the avoided energy input and assumed fuel prices, as discussed in section 8.3.2.
The electricity sector is also expected to use less natural gas in the regulatory scenario as compared to the BAU scenario. This leads to an overall avoided present value of natural gas cost of approximately $11 million. This is calculated based on the avoided energy input and assumed fuel prices.
The present value of avoided fuel costs is estimated to be about $109 million.
8.5.5 Avoided variable O&M costs
There are avoided variable O&M costs associated with decreased generation from coal-fired units and natural gas units. The present value of avoided variable O&M costs is estimated to be about $10 million. These costs are calculated based on the assumed average variable O&M costs of $4.38/MWh/year for coal units in Nova Scotia, and $8.45/MWh/year for natural gas units in Nova Scotia.
Table 12: Variable O&M costs (present value in millions of 2010 dollars)
| Cost category | 2015 | 2020 | 2025 | 2030 | Cumulative (2015 to 2030) |
|---|---|---|---|---|---|
| Net variable O&M | 0.00 | -0.01 | 0.46 | 0.45 | –10.04 |
In summary, the OiC and the 2021–2030 provincial GHG emission caps generate incremental avoided generation costs for Nova Scotia. Although fixed O&M costs increase during 2015–2030, the savings from avoided decommissioning costs and avoided fuel costs outweigh the increased costs, thereby reducing total generation costs by about $84 million in present value.
8.5.6 Foregone net electricity exports
From 2015 to 2030, electricity imports from the United States would decrease by 0.3 TWh, while electricity exports to the United States would decline by 3.5 TWh (see Table 13). The reduction in total generation would cause the provinces to reduce their supply to the United States, since this generation would now be required to serve the domestic market.
Table 13: Change in electricity imports and exports by region, 2015–2030 (present value in millions of 2010 dollars)
| Region | Change in Imports (TWh) | PV of Reduction in Electricity Imports ($M 2010) | Change in Exports (TWh) | PV of Reduction in Electricity Exports ($M 2010) |
|---|---|---|---|---|
| Canada | –0.32 | 12 | –3.54 | 62 |
The price forecasts for imports and exports were calculated within E3MC as described in section 8.3.4.
From 2015 to 2030, the total present value of decreased cumulative electricity imports is approximately $12 million, which represents a benefit to Canadians. From 2015 to 2030, the present value of reduced cumulative electricity exports would be about $62 million. Overall, between 2015 and 2030, there is expected to be a reduction in net electricity exports of about $50 million in present value.
8.5.7 Avoided administrative costs
In addition to the avoided costs of generation, the electricity sector in Nova Scotia would also see benefits from avoided administrative costs of reporting. Under the BAU scenario, it is assumed the electricity producer in Nova Scotia would apply for compliance flexibility. (see footnote 26) The electricity producer would also be required to submit annual reports. Under the regulatory scenario, the electricity producer would no longer need to comply with federal regulatory requirements, and, therefore, would no longer need to submit annual reports to the federal government. This would lead to total savings of about $1,100 between 2015 and 2030 in present value.
8.6 Avoided government costs
The federal government is expected to realize incremental cost savings related to inspections, investigations, and measures to deal with any alleged violations, and compliance and promotion activities.
The annual enforcement savings are estimated to be about $2,500, broken down as follows: roughly $500 for avoided inspections (which includes operations and maintenance savings, transportation and sampling savings), about $1,000 for avoided investigations, about $500 for avoided measures to deal with alleged violations (including warnings, environmental protection compliance orders and injunctions) and about $500 for avoided prosecutions.
There would also be compliance and promotion savings to the federal government. This is a one-time saving of approximately $2,000 expected to occur in 2021.
The present value of these savings is estimated to be about $22,227 over the period of 2015–2030.
8.7 Environmental and health impacts
8.7.1 Benefits from GHG emission reductions
The OiC and the 2021–2030 provincial GHG emission caps are expected to result in a cumulative reduction in generation from coal units and natural gas units relative to the BAU scenario. This is expected to result in cumulative reductions in GHG emissions over 2015–2030 compared to the BAU scenario.
Table 14 presents the cumulative GHG emission reductions over the 2015–2020 and 2021–2030 periods in the BAU and regulatory scenarios, and the associated value of benefits from GHG reductions calculated using the social cost of carbon values described in section 8.3.3. Over the 2015–2020 period, the OiC and the 2021–2030 provincial GHG emission caps are expected to result in an incremental reduction of 0.3 Mt CO2e of GHG emissions, resulting in a present value of incremental GHG benefits of about $9 million. Over the 2021–2030 period, incremental GHG reductions are estimated to be about 3 Mt CO2e of GHG emissions, resulting in benefits of approximately $80 million in present value.
Table 14: GHG emissions (Mt) in Nova Scotia, 2015–2030
| 2015–2020 | 2021–2030 | |||||
|---|---|---|---|---|---|---|
| BAU Scenario | Regulatory Scenario | Incremental | BAU Scenario | Regulatory Scenario | Incremental | |
| GHG emissions (Mt CO2e) | 38.28 | 37.97 | –0.31 | 57.53 | 54.51 | –3.02 |
| GHG benefits ($M) | 8.63 | 79.75 | ||||
8.7.2 Potential health and environmental impacts of changes in air pollutant emissions
The implementation of the OiC and the 2021–2030 provincial GHG emission caps are expected to have negligible impacts on health and the environment in Nova Scotia as well as in the rest of Canada.
Changes in air pollutant emission levels
Air pollutants such as sulphur oxides (SOx), nitrogen oxides (NOx), particulate matter (PM), volatile organic compounds (VOC), carbon monoxide (CO), ammonia (NH3) and ground-level ozone (O3) are associated with smog formation, acid rain, and a wide range of health and environmental impacts. Coal-fired electricity generation is a contributor to emissions of air pollutants in Canada.
As a result of the OiC and the 2021–2030 provincial GHG emission caps, the following cumulative changes to electricity generation in Canada are expected over the period 2015 to 2030:
- Coal-fired electricity generation is projected to decrease by 3.1 TWh; and
- Natural gas generation is projected to decrease by 0.26 TWh.
These electricity generation changes would result in a decline in NOx and PM2.5 emissions and an increase in SOx emissions from the electricity generation sector relative to the BAU scenario. Table 15 shows the cumulative changes from 2015 to 2030 both in absolute terms (kilotonnes) and percentage terms as compared to the BAU scenario. Nova Scotia has provincial air quality regulations that regulate the amount of air pollutants the electricity producer can emit. (see footnote 27) These regulations are present both in the BAU and the regulatory scenarios of the analysis.
Both NOx and PM2.5 emissions are expected to be below the allowed levels in both the BAU and the regulatory scenarios, while SOx is expected to be at the allowed level. The reduction in NOx and PM2.5 emissions is due to reduced coal-fired electricity generation between 2015 and 2030 in the regulatory scenario relative to the BAU scenario. In contrast, the increase in SOx is largely due to the increased coal-fired electricity generation in year 2030 in the regulatory scenario relative to the BAU scenario.
Table 15: Cumulative changes in air pollutant emissions
| Criteria air contaminant | 2015–2030 (Kilotonnes) | % Change |
|---|---|---|
| NOx (kt) | –8.15 | –4% |
| SOx (kt) | 7.45 | 1% |
| PM2.5 (kt) | –0.06 | –1% |
Previous analysis conducted by Environment Canada and Health Canada indicated the federal regulations on GHG emissions from coal-fired electricity generation would result in a reduction of air pollution emissions from coal-fired electricity plants, resulting in improved air quality. In Nova Scotia, it was estimated that air quality improvements would result in health benefits valued at approximately $7 million (PV, 2010 dollars) and $0.03 million (PV, 2010 dollars) in environmental benefits over the 2015 to 2030 period. As presented in Table 15, the difference in emission levels would be fairly minor for the period 2015 to 2030 compared to the BAU scenario. Therefore, air quality in Nova Scotia under the OiC and the 2021–2030 provincial GHG emission caps is expected to be fairly similar to air quality under the federal regulations on GHG emissions from coal-fired electricity generation. Therefore, it is expected that the OiC and the 2021–2030 provincial GHG emission caps would have negligible impacts on health and the environment in Nova Scotia and the rest of Canada over the 2015 to 2030 period.
8.8 Cost-benefit statement
Table 16 below summarizes the incremental impacts of the OiC and the 2021–2030 provincial GHG emission caps.
Table 16: Incremental cost-benefit statement (2015–2030) [present value in millions of 2010 dollars] (see footnote 28)
| Incremental costs and benefits | 2015–2020 | 2021–2030 | 2030 Total |
|---|---|---|---|
| A. Monetized costs | |||
| A1. Net refurbishment costs | 56 | –17 | 39 |
| A2. Generation costs | 2 | 31 | 33 |
| Additional fixed operating and maintenance costs | 2 | 31 | 33 |
| A3. Reduced net electricity exports | 8 | 42 | 50 |
| Total costs | 67 | 56 | 122 |
| B. Monetized benefits | |||
| B1. Avoided decommissioning costs | –1 | 51 | 50 |
| B2. Avoided generation costs | 17 | 141 | 159 |
| Net avoided capital costs | 0 | 21 | 21 |
| Avoided fixed operating and maintenance costs | 8 | 11 | 19 |
| Avoided variable operating and maintenance costs | 1 | 9 | 10 |
| Avoided coal costs | 13 | 84 | 98 |
| Avoided natural gas costs | –5 | 16 | 11 |
| B3. Avoided administrative costs (see note 6*) | 0 | 0 | 0 |
| B4. Avoided government costs (see note 7*) | 0 | 0 | 0 |
| B5. GHG reductions | 9 | 80 | 88 |
| Total benefits | 25 | 272 | 297 |
| C. Net present value | –42 | 216 | 175 |
D. Qualitative impacts Natural gas and coal sectors are not expected to be impacted by the OiC and the 2021–2030 provincial GHG emission caps. Electricity price impacts are expected to be negligible. For a more detailed analysis, see section 8.9. |
|||
- Note 6* Appears as $0 million due to rounding, estimated PV of approximately $1,100 over 2015–2030.
- Note 7* Appears as $0 million due to rounding, estimated PV of approximately $22,227 over 2015–2030.
8.9 Distributional and competitiveness analysis
8.9.1 Natural gas sector
The main consumers of natural gas in the Maritimes are electric utility companies and refineries in Nova Scotia and New Brunswick. Natural gas prices in the Maritimes have generally been linked to New England prices since the construction of the Maritimes & Northeast Pipeline (M&NP). (see footnote 29) As market natural gas prices in the Maritimes tend to fluctuate significantly on a monthly basis, natural gas demand above purchases from futures contracts is highly volatile as industry adjusts its consumption as prices vary.
Recently, the growth of shale gas production in the United States, especially the Marcellus Shale, contributed to a decline in natural gas prices throughout North America, resulting in less favorable economic conditions and making it unlikely that any greenfield projects in the Maritimes will go forward at this time. As a result, the expected growth in demand for gas in the Maritimes over the next decade may lead to demand exceeding production. This will require the Maritimes to acquire natural gas from other North American sources during peak demand periods, which may require additional infrastructure, such as pipeline capacity and additional natural gas storage facilities, as well as other measures such as contracting firm capacity.
The OiC and the 2021–2030 provincial GHG emission caps are expected to result in a 1% decrease in natural gas use to generate electricity; therefore, no additional infrastructure would be required as a result of the suspension of the federal regulations.
8.9.2 Coal sector
Most of the coal used for electricity generation in Nova Scotia is imported from other countries such as Columbia, the United States, and Venezuela. As a result, the decrease in electricity generation from coal is not expected to have an impact on employment in the Canadian coal mining industry. (see footnote 30)
With regard to employment in the electricity generation sector, the continued operation of coal-fired units is expected to result in more employment at coal-fired facilities compared to the BAU scenario. On the other hand, the reduction in natural gas capacity is expected to result in reduced employment at natural gas facilities. The overall impact is expected to be slightly positive as natural gas units require fewer employees to operate than coal-fired units.
8.9.3 Electricity prices in Nova Scotia
Residential consumers
Provincial electricity prices are expected to increase in the future with or without the application of the federal regulations on GHG emissions from coal-fired electricity generation. This is mainly due to the phased-in application of the province’s renewable requirement and the new natural gas capacity that is expected to be installed in both scenarios. For the 2015–2020 period, an average annual price increase of 0.05 cents/kWh over the BAU scenario is mainly due to additional generation from natural gas to compensate for the decommissioning of one coal plant. For the 2021–2030 period, an average annual price increase of 0.02 cents/kWh is due to additional net imports of renewable electricity from Newfoundland and Labrador (as shown in Table 17).
Overall, for the 2015–2030 period, the average annual change is estimated to be 0.04 cents/kWh. Allocating this price increase to the 2011 average Nova Scotia electricity consumption of 10 987 kWh, (see footnote 31) the average monthly increase in electricity cost per household is estimated to be about $0.37/month.
Table 17: Impacts on residential electricity prices (cents/kWh)
| 2015–2020 | 2021–2030 | 2015–2030 | |||||
|---|---|---|---|---|---|---|---|
| BAU scenario | Regulatory scenario | Change | BAU scenario | Regulatory scenario | Change | Average annual change | |
| Nova Scotia average annual electricity prices (cents/kWh) | 17.81 | 17.86 | 0.05 | 21.22 | 21.24 | 0.02 | 0.04 |
Industrial consumers
The price impacts for industrial consumers of electricity are expected to be the same as for residential consumers. That is, even though industrial electricity prices are lower than residential electricity prices, the expected average annual increase in industrial prices over the 2015–2030 period is estimated to be 0.04 cents/kWh (as shown in Table 18).
Table 18: Impacts on industrial electricity prices (cents/kWh)
| 2015–2020 | 2021–2030 | 2015–2030 | |||||
|---|---|---|---|---|---|---|---|
| BAU scenario | Regulatory scenario | Change | BAU scenario | Regulatory scenario | Change | Average annual change | |
| Nova Scotia average annual electricity prices (cents/kWh) | 11.65 | 11.71 | 0.05 | 14.23 | 14.25 | 0.02 | 0.04 |
Given the average annual increase is expected to be small, the OiC and the 2021–2030 provincial GHG emission caps are expected to result in negligible impacts on the competitiveness of the industrial sector in Nova Scotia.
8.10 Sensitivity analysis
8.10.1 Univariate sensitivity analysis
A univariate sensitivity analysis was conducted on key variables to assess the impact of uncertainty on the results. This requires changing one variable at a time (holding all other variables/impacts constant). The sensitivity analysis (see Table 19) shows that the results are robust in terms of demonstrating a positive net present value for the OiC and the 2021–2030 provincial GHG emission caps across a broad range of plausible values for variables and assumptions. The results are most sensitive to varying the SCC value.
Table 19: Results of sensitivity analysis (millions of 2010 dollars)
| Sensitivity Variables | NET PRESENT VALUE | ||
|---|---|---|---|
| Lower | Central | Upper | |
| 1. Discount rate: 7% | 103 | 175 | n/a |
| 2. Refurbishment costs for end-of-useful life coal units: –50%, +50% | 155 | 175 | 194 |
| 3. Decommissioning costs: +50%, –50% | 150 | 175 | 200 |
| 4. SCC at the 95th percentile estimate | n/a | 175 | 437 |
8.10.2 Scenario sensitivity analysis
Scenario sensitivity analysis was also undertaken using Environment Canada’s E3MC model. As the E3MC model is dynamic in nature, a change in one parameter will have impacts on other variables.
1. Fuel price sensitivity
Projected energy prices are subject to uncertainty and are most appropriately analyzed as a range of plausible outcomes. Therefore, to better understand the sensitivity of the overall results (NPV) to market fluctuations, impacts associated with the OiC and the 2021–2030 provincial GHG emission caps were calculated as a result of higher or lower fuel prices.
To test the impacts of the OiC in a scenario with high fuel prices, the future prices of natural gas were modelled to follow the high growth trend of prices at Henry Hub, which was provided by the National Energy Board. Future values of coal prices were assumed to increase by 20% over the prices used in the central analysis case. Under these price assumptions the net present value of the impacts associated with the OiC and the 2021–2030 provincial GHG emission caps remains positive, and the price impact on electricity consumers is negligible.
Similar analysis was done for a scenario with low fuel prices, where the future price of natural gas was modelled to follow the low growth trend of prices at Henry Hub as provided by the National Energy Board, and mine-mouth coal prices were assumed to decrease by 20%. Under this scenario, similar to the previous scenario, the net present value of impacts associated with the OiC and the 2021–2030 provincial GHG emission caps remains positive, and the price impact on electricity consumers is negligible.
2. Extending the analytical period to 2035
The incremental impacts of the OiC and the 2021–2030 provincial GHG emission caps are evaluated over an analytical period of 16 years (2015–2030), as it is the period currently covered under Nova Scotia’s GHG emission caps. To better understand the longer-term incremental impacts of the OiC and the 2021–2030 provincial GHG emission caps, the analytical period was extended to 2035. Based on consultations with Nova Scotia Environment officials, it was assumed that the provincial GHG emission caps in the regulatory scenario would continue to decline from 4.5 Mt CO2e in 2030 to 3.9 Mt CO2e in 2035.
Overall results
Between 2015 and 2035, as a result of the OiC and the 2021–2035 provincial GHG emissions caps, there is an overall reduction in generation from coal and natural gas units. This decrease in generation is offset by increased imports of renewable energy from Newfoundland and Labrador, which leads to an overall reduction in exports of electricity from Canada to the United States.
Overall, between 2015 and 2035, the NPV is estimated to be about $179 million, which is similar to the NPV estimated for the period of 2015–2030 (about $175 million). The present value of the total costs is estimated to be about $256 million, which is largely due to refurbishment costs ($98 million), generation costs ($79 million), and reduced exports of electricity to the United States ($79 million). The present value of the total benefits between 2015 and 2035 is about $435 million, which is largely due to avoided generation costs ($298 million), benefits from reduced GHG emissions ($87 million), and avoided decommissioning costs ($50 million).
Capacity
As previously discussed, in the BAU scenario, there is a significant increase in new natural gas capacity due to coal-fired unit closures in 2030. However, after 2030, no new natural gas capacity is expected to be built.
In the regulatory scenario, despite the continued operation of coal-fired units, the electricity producer is expected to install a new natural gas capacity of 100 MW in 2032 (Table 20). Over the 2015–2035 period, relative to the BAU scenario, new natural gas capacity in the regulatory scenario is expected to be 450 MW lower.
Table 20: Increases in new natural gas capacity (MW), 2031–2035 and 2015–2035
| 2031–2035 | 2015–2035 | |
|---|---|---|
| BAU scenario | 0 | 700 |
| Regulatory scenario | 100 | 250 |
| Incremental | 100 | –450 |
Generation
In the regulatory scenario, generation from coal-fired units continues to decline after 2030 due to the declining provincial GHG emission caps. Despite this, generation from coal-fired units between 2031 and 2035 in the regulatory scenario remains 5% higher than that in the BAU scenario, given that there are seven coal-fired units in operation in the regulatory scenario compared to two coal-fired units in the BAU scenario (Table 21).
Generation from natural gas is also expected to increase over time in the regulatory scenario. As discussed previously, natural gas capacity in the regulatory scenario is 450 MW lower than that in the BAU scenario. As a result, natural gas generation in the regulatory scenario is 7% lower than that in the BAU scenario over 2031–2035.
Table 21: Generation by fuel type (TWh), 2031–2035 and 2015–2035
| 2031–2035 | 2015–2035 | |||||
|---|---|---|---|---|---|---|
| BAU scenario | Regulatory scenario | % Difference | BAU scenario | Regulatory scenario | % Difference | |
| Coal (see note 8*) | 10.6 | 11.1 | 5% | 83.7 | 81.1 | –3% |
| Natural gas | 17.5 | 16.4 | –7% | 50.0 | 48.6 | –3% |
| Non-emitting (see note 9*) | 17.6 | 17.6 | 0% | 67.5 | 67.6 | 0% |
- Note 8* Coal generation includes generation from coal and petroleum coke.
- Note 9* Non-emitting = Biomass + geothermal + hydro + landfill gases/waste + nuclear + solar
Cumulatively, over the 2015–2035 period, generation from both coal and natural gas is expected to be about 3% lower relative to the BAU scenario (Table 21).
Costs and avoided costs
The directional changes for incremental costs and avoided costs to the electricity producer over the 2015–2035 period are consistent with the changes described in section 8.5 for the period of 2015–2030.
Changes in GHG emissions and air pollutant emissions
Given that the GHG emissions intensity of coal-fired units is generally significantly higher than that of natural gas units, the changes in generation mix described above are expected to result in a minor cumulative increase in GHG emissions of 0.04 Mt CO2e over the 2031–2035 period (Table 22). Overall, the OiC and the 2021–2030 provincial GHG emission caps are expected to achieve a reduction of approximately 3 Mt CO2e of GHG emissions between 2015 and 2035.
Table 22: Incremental changes in GHG reduction in different time periods (Mt CO2e)
| Time period | 2015–2030 | 2015–2035 |
|---|---|---|
| GHG reduction (Mt) | 3.32 | 3.28 |
The additional operation of coal-fired units post-2030 would result in changes in emissions of air pollutants. More specifically, over the period of 2015–2035, SOx would increase by approximately 6%, and PM2.5 by about 1%, while NOx would decrease by about 4%. Table 23 shows the incremental percentage changes of emissions of air pollutant.
Table 23: Incremental percentage changes in air pollutants over 2015 to 2035 (kilotonnes)
| Air pollutant emissions | % Change over 2015–2035 |
|---|---|
| NOx | –3.62% |
| SOx | 6.38% |
| PM2.5 | 0.55% |
9. “One-for-One” Rule
The OiC is expected to reduce the administrative costs to the electricity producer, and therefore result in an “OUT” under the “One-for-One” Rule.
Under the federal regulations on GHG emissions from coal-fired electricity generation, the electricity producer is assumed to apply for compliance flexibility that allows two older coal-fired units to operate a few more years after the end of their useful life by swapping the remaining years of two younger coal-fired units. (see footnote 32) Once the producer is participating in the flexibility provision, annual reports that would otherwise not have been required would need to be submitted for old units that continue operating. (see footnote 33) By suspending the application of the federal regulations on GHG emissions from coal-fired electricity generation in Nova Scotia, the OiC would remove these administrative burdens imposed on the electricity producer.
The analysis assumes a one-time substitution application would be avoided, which would have taken 10 hours to complete. In addition, the analysis assumes that 9.5 annual reports, which each take two hours to complete, would no longer be required by the federal government.
For the purposes of meeting the requirements of the “One-for-One” Rule, the administrative costs associated with the OiC were estimated using a 7% discount rate, a 10-year time frame, and 2010 Canadian dollars as per Treasury Board Secretariat (TBS) guidelines. (see footnote 34) This is to be consistent with the assumptions made for the “One-for-One” Rule in the Regulatory Impact Analysis Statement for the federal regulations on GHG emissions from coal-fired electricity generation. (see footnote 35) The OiC is expected to reduce administrative costs by approximately $870 in present value over 10 years, which is equivalent to an annualized value of about $120.
10. Small business lens
The small business lens would not apply to the OiC as no small business would be affected. The OiC is expected to affect one stakeholder, which is the only owner or operator of coal units in the province and which has approximately 1 700 employees. (see footnote 36)
11. Consultation
11.1. Consultation prior to the publication of the proposed OiC in the Canada Gazette, Part 1
The development of an equivalency agreement and the OiC to suspend the application of federal regulations on GHG emissions from coal-fired electricity generation in Nova Scotia is linked to the consultation process that was undertaken during the development of the federal regulations on GHG emissions from coal-fired electricity generation, during which both governments announced that they were developing an equivalency agreement in an effort to ensure that the sector does not face two sets of GHG regulations.
On September 15, 2012, the Government of Canada published a notice of availability of the draft Agreement on the Equivalency of Federal and Nova Scotia Regulations for the Control of Greenhouse Gas Emissions from Electricity Producers in Nova Scotia (equivalency agreement) in the Canada Gazette, Part I. Upon publication of the draft agreement, a 60-day consultation period was initiated, allowing stakeholders and interested parties an opportunity to submit formal comments for consideration.
Two submissions were received during the 60-day consultation period, one from the Canadian Electricity Association and one from Nova Scotia Power Inc. Both submissions were strongly supportive of the draft equivalency agreement as a practical and effective means of reducing GHG emissions from the electricity sector in Nova Scotia, in the manner most appropriate for the province.
Extensive bilateral consultations were held with Nova Scotia government officials and with representatives from the electricity producer, focusing on key policy and technical parameters used in support of the cost-benefit analysis. Technical consultations focused on parameters related to electricity generation forecasts in the province for integration into E3MC used by EC to model domestic GHG emissions.
11.2 Consultation after the publication of the proposed OiC in the Canada Gazette, Part I
On June 27, 2014, the Government of Canada published the proposed OiC and initiated a 60-day comment period. This comment period ended on August 26, 2014. No comments were received and as a result, no changes were made to the Order or the cost-benefit analysis.
12. Regulatory cooperation
The governments of Canada and Nova Scotia have been working collaboratively to address GHG emissions since 2009. In January 2010, the Minister of the Environment of Canada and the Minister of the Environment of Nova Scotia signed the Canada-Nova Scotia Agreement in Principle on Efforts to Address Climate Change (AiP). The AiP was developed with a view to an eventual equivalency agreement, as provided for under CEPA 1999.
In line with objectives outlined in the AiP, Environment Canada and Nova Scotia published announcements regarding their intent to work towards an equivalency agreement in respect of the federal regulations on GHG emissions from coal-fired electricity generation. Both governments have been collaborating closely on the development of the equivalency agreement in respect of the control of GHG emissions from Nova Scotia’s electricity sector.
As part of this process, in September 2013, Nova Scotia amended its regulations to include increasingly stringent caps on electricity sector GHG emissions from 2021 through 2030. With the new GHG emission caps for the electricity sector in place, both governments are satisfied that the regulatory approach in Nova Scotia will yield equivalent GHG outcomes, compared to those which would have occurred as a result of the federal regulations on GHG emissions from coal-fired electricity generation in Nova Scotia.
13. Rationale
GHG emission levels from Nova Scotia’s electricity sector that would have occurred under the federal regulations on GHG emissions from coal-fired electricity generation were modelled by Environment Canada and compared to those expected to occur under the Nova Scotia GHG regulations both for the period of the equivalency agreement (2015–2019) and for the 2020–2030 period.
Environment Canada is satisfied that the effect on GHG emission levels of the limits, determined in tonnes of CO2e, that are applicable under Nova Scotia’s Environment Act and the Greenhouse Gas Emissions Regulations is, for the calendar years 2015 to 2019, and is expected to be, for the calendar years 2020 to 2030, equivalent to the effect on emission levels of the limits imposed under CEPA 1999 and the Reduction of Carbon Dioxide Emissions from Coal-fired Generation of Electricity Regulations. The effect of the GHG emission limits under each regime will be re-evaluated prior to amending or renewing the agreement, to ensure that CEPA 1999 conditions for the equivalency agreement continue to be satisfied.
Environment Canada is also satisfied that Nova Scotia’s Environment Act contains mechanisms that are similar to sections 17 and 20 of CEPA 1999 for the investigation of alleged offences, and therefore that all CEPA requirements related to equivalency agreements have been met.
An order in council suspending the application of the federal regulations on GHG emissions from coal-fired electricity generation in Nova Scotia is recommended to minimize regulatory duplication in Nova Scotia, and to allow the province to attain agreed GHG outcomes in a way that best suits its particular circumstances.
This approach reduces regulatory duplication and financial burden, resulting in a NPV of $122 million. This is in line with Government of Canada objectives regarding regulatory coordination and cooperation with relevant jurisdictions.
14. Implementation, enforcement and service standards
The Order in Council declares that the Reduction of Carbon Dioxide Emissions from Coal-fired Generation of Electricity Regulations do not apply in Nova Scotia. As the federal regulations on GHG emissions from coal-fired electricity generation stand down, only the provincial regulatory regime applies. No federal enforcement is therefore envisioned in Nova Scotia.
Nova Scotia will provide Canada with annual statistics on its enforcement actions concerning the Greenhouse Gas Emission Regulations.
15. Performance measurement and evaluation
The equivalency agreement will terminate on December 31, 2019, unless terminated earlier by either party giving the other at least three months’ notice. The effect of the GHG emission limits under each regime will be re-evaluated prior to amending or renewing the agreement, to ensure that CEPA 1999 conditions for equivalency agreements continue to be satisfied.
The equivalency agreement outlines information-sharing provisions regarding the administration of the agreement. Requirements to share annual reports on the quantity of electricity generated by each coal-fired electricity unit in Nova Scotia, and annual reports and compliance period reports required under sections 5 and 6 of the Greenhouse Gas Emissions Regulations, will facilitate the evaluation of conditions for renewal.
Contacts
Jennifer Kerr
Manager
Air Emissions Priorities Division
Environment Canada
351 Saint-Joseph Boulevard
Gatineau, Quebec
K1A 0H3
Fax: 819-953-7962
Email: AEP.PEA@ec.gc.ca
Yves Bourassa
Director
Regulatory Analysis and Valuation Division
Environment Canada
10 Wellington Street
Gatineau, Quebec
K1A 0H3
Fax: 819-953-3241
Email: RAVD.DARV@ec.gc.ca
- Footnote a
S.C. 2004, c. 15, s. 31 - Footnote b
S.C. 1999, c. 33 - Footnote 1
www.tbs-sct.gc.ca/rtrap-parfa/cdrm-dcgr/cdrm-dcgrtb-eng.asp - Footnote 2
Given that the Government of Nova Scotia amended its regulations to include GHG emission caps for the 2021–2030 period as a condition of the equivalency agreement, these caps are incremental and therefore incorporated in the regulatory scenario. - Footnote 3
Numbers may not sum up due to rounding. - Footnote 4
http://ec.gc.ca/ges-ghg/default.asp?lang=En&n=68EE206C-1&offset=3&toc=show (Table S-3: Canada’s Emissions Breakdown 2012, by Economic Sector). - Footnote 5
http://gazette.gc.ca/rp-pr/p2/2012/2012-09-12/pdf/g2-14619.pdf, September 12, 2012. - Footnote 6
Power Advisory LLC. Analysis of Proposed Development of the Maritime Link and Associated Energy from Muskrat Falls Relative to Alternatives. http://novascotia.ca/homepage/argyle/hottopics/AnalysisOfElectricitySupplyAlternatives.pdf. - Footnote 7
Potential generation (GWh) = Capacity (GW) × 365 days × 24 hours per day. - Footnote 8
Nova Scotia Department of Environment (2009). Toward a Greener Future: Nova Scotia’s Climate Change Action Plan. Retrieved from http://climatechange.gov.ns.ca/doc/ccap.pdf. - Footnote 9
www.novascotia.ca/just/regulations/regs/elecrenew.htm - Footnote 10
Manufacturing industries, including mining and oil and gas extraction. - Footnote 11
Numbers may not add up due to rounding. - Footnote 12
www.tbs-sct.gc.ca/rtrap-parfa/analys/analystb-eng.asp - Footnote 13
www.novascotia.ca/just/regulations/regs/envairqt.htm - Footnote 14
www.efficiencyns.ca/ - Footnote 15
This is based on EC’s consultation with stakeholders. - Footnote 16
The CANSIM tables used are 127-0005 for cost of fuel consumed for electric power generation by electric utility thermal plants and 127-0004 for fuel consumed for electric power generation by electric utility thermal plants. - Footnote 17
The Henry Hub price in 2012 dropped steeply (almost 50%) relative to where the price was in 2011. Since such drastic shifts in the Henry Hub price are not usually experienced in the New England market (called the City Gate price), the trend in City Gate price in Maine from 2011 to 2012 was applied to the 2012 gas price. For 2013, the price was set at the 2011 level, since the Maine City Gate natural gas price for available months looked to increase to about the same levels as 2011 (data for July and August are missing). From 2014 and onwards, the price follows the trend of the Henry Hub price. - Footnote 18
Contact Environment Canada’s Economic Analysis Directorate for any questions regarding methodology, rationale, or policy. - Footnote 19
Technical support document, U.S. Interagency Working Group on Social Cost of Carbon, IWGSCC, 2010, “Social Cost of Carbon for Regulatory Impact Analysis Under Executive Order 12866,” U.S. government. - Footnote 20
The value of $28.15/tonne of CO2 in 2013 (in 2010 Canadian dollars) and its growth rate have been estimated using an arithmetic average of the three models (PAGE, FUND and DICE). - Footnote 21
“Fat-Tailed Uncertainty in the Economics of Catastrophic Climate Change,” Review of Environmental Economics and Policy, 5(2), pp. 275–292 (summer 2011). - Footnote 22
“Fat Tails, Thin Tails, and Climate Change Policy,” Review of Environmental Economics and Policy, summer 2011. - Footnote 23
The value of $111.55/tonne of CO2 in 2013 (in 2010 Canadian dollars) and its growth rate have been estimated using an arithmetic average of the two models (PAGE and DICE). The FUND model has been excluded in this estimate because it does not include low probability and high-cost climate damage. - Footnote 24
Based on estimates from recently refurbished coal units and decommissioned coal units. - Footnote 25
Capital costs = capacity (MW) × unit-level cost of building the capacity ($/MW). - Footnote 26
www.gazette.gc.ca/rp-pr/p2/2012/2012-09-12/pdf/g2-14619.pdf, September 12, 2012. - Footnote 27
www.novascotia.ca/just/regulations/regs/envairqt.htm - Footnote 28
Numbers may not sum up due to rounding. - Footnote 29
The pricing of natural gas in New England reflects three market hubs: TGPZone 6; AGT-City Gates, and Dracut. - Footnote 30
IRP Vol 2. www.nspower.ca/en/home/about-us/electricity-rates-and-regulations/regulatory-initiatives/archive/irp.aspx - Footnote 31
The 2011 average electricity consumption in Nova Scotia was calculated by dividing total residential electricity consumption in Nova Scotia by total households in Nova Scotia in 2011 using the Office of Energy Efficiency’s Comprehensive Energy Use Database Table which can be retrieved at http://oee.nrcan.gc.ca/corporate/statistics/neud/dpa/showTable.cfm?type=CP§or=res&juris=ns&rn=1&page=4&CFID=32359756&CFTOKEN=817677ccd5f5f7ef-FADD3FEAFD04-AE30-C183A7FE3BD233D6. - Footnote 32
www.gazette.gc.ca/rp-pr/p2/2012/2012-09-12/pdf/g2-14619.pdf, September 12, 2012. - Footnote 33
Annual reports are not required to be submitted for units that close upon reaching their end of useful life or that have not reached their end of useful life. - Footnote 34
www.tbs-sct.gc.ca/rtrap-parfa/cabtrib-lfarie/cabtrib-lfarie07-eng.asp - Footnote 35
www.gazette.gc.ca/rp-pr/p2/2012/2012-09-12/pdf/g2-14619.pdf, September 12, 2012. - Footnote 36
www.nspower.ca/en/home/about-us/who-we-are/default.aspx